

Mapping a locus for susceptibility to HIV-1-associated nephropathy to mouse chromosome 3
- PMID: 14983036
- PMCID: PMC356977
- DOI: 10.1073/pnas.0308649100
Mapping a locus for susceptibility to HIV-1-associated nephropathy to mouse chromosome 3
Abstract
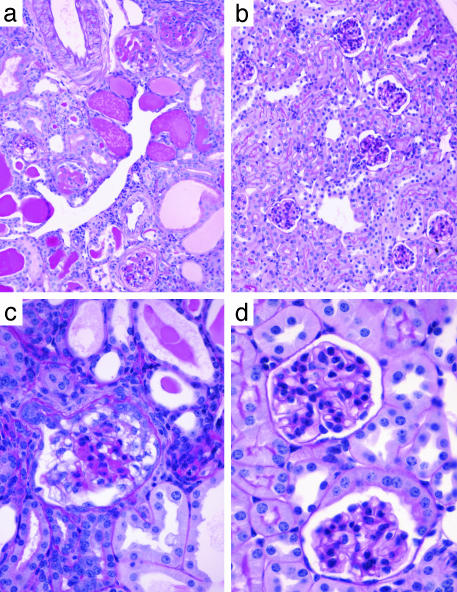
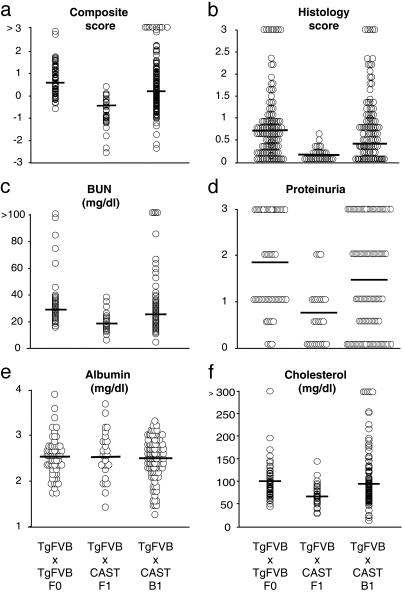
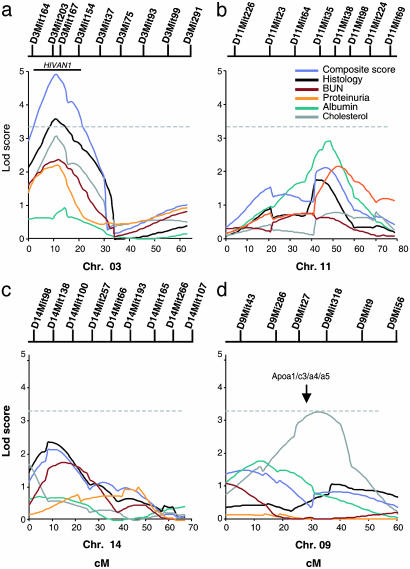
HIV-1-associated nephropathy (HIVAN) is a major complication of HIV-1 infection with distinct pathologic features. Introduction of the HIV-1 genome into mice results in a renal disease with all of the histologic and clinical hallmarks of HIVAN on the FVB/N genetic background (TgFVB). We assessed the influence of genetic background on the development or progression of HIVAN by making F1 hybrids of TgFVB with five other inbred strains (CBA, DBA/2, CAST/Ei, C3H/He, BALB/c) and determining phenotypes relevant to renal failure among transgenic offspring (histology, blood urea nitrogen, proteinuria, serum albumin, and serum cholesterol). We found striking variation in phenotypes among F1s, ranging from severe renal disease to no renal disease whatsoever (P<0.001 for ANOVA across all groups). To map genes responsible for this variation, we produced a backcross of TgFVB/CAST F1 x TgFVB. By genome-wide analysis of linkage in 185 heterozygous transgenic backcross mice, we identified a locus on chromosome 3A1-3, HIVAN1, that showed highly significant linkage to renal disease [logarithm of odds (lod) score 4.9 at D3Mit203, accounting for 15% of the variance in renal disease]. Other loci on chromosomes 11, 14, and 16 were suggestive of linkage to renal disease, and a locus on chromosome 9 influenced serum cholesterol but not nephropathy. Interestingly, HIVAN1 is syntenic to human chromosome 3q25-27, an interval showing suggestive evidence of linkage to various nephropathies. These findings demonstrate a strong genetic influence on HIVAN and demonstrate a major renal disease susceptibility locus on mouse chromosome 3A1-3.
Figures
References
-
- U.S. Renal Data System (2003) Annual Data Report: Atlas of End-Stage Renal Disease in the United States (National Institutes of Health, National Institute of Diabetes and Digestive and Kidney Diseases, Bethesda, MD).
-
- McClellan, W. M. & Flanders, W. D. (2003) J. Am. Soc. Nephrol. 14, S65-S70. - PubMed
-
- Tarver-Carr, M. E., Powe, N. R., Eberhardt, M. S., LaVeist, T. A., Kington, R. S., Coresh, J. & Brancati, F. L. (2002) J. Am. Soc. Nephrol. 13, 2363-2370. - PubMed
-
- Kramer, H. J., Nguyen, Q. D., Curhan, G. & Hsu, C. Y. (2003) J. Am. Med. Assoc. 289, 3273-3277. - PubMed
-
- Klotman, P. E. (1999) Kidney Int. 56, 1161-1176. - PubMed
Publication types
MeSH terms
Substances
Grants and funding
LinkOut - more resources
Full Text Sources
Medical
Molecular Biology Databases
Miscellaneous
