

Characterization of severe acute respiratory syndrome coronavirus genomes in Taiwan: molecular epidemiology and genome evolution
- PMID: 14983045
- PMCID: PMC356986
- DOI: 10.1073/pnas.0307904100
Characterization of severe acute respiratory syndrome coronavirus genomes in Taiwan: molecular epidemiology and genome evolution
Abstract
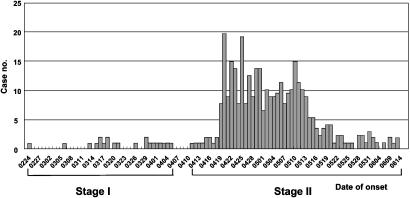
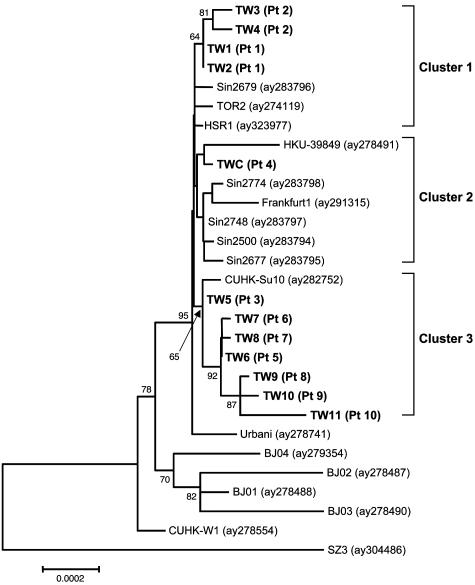
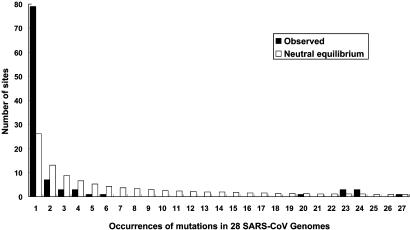
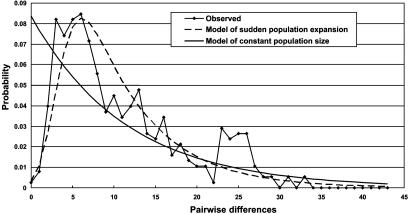
Since early March 2003, the severe acute respiratory syndrome (SARS) coronavirus (CoV) infection has claimed 346 cases and 37 deaths in Taiwan. The epidemic occurred in two stages. The first stage caused limited familial or hospital infections and lasted from early March to mid-April. All cases had clear contact histories, primarily from Guangdong or Hong Kong. The second stage resulted in a large outbreak in a municipal hospital, and quickly spread to northern and southern Taiwan from late April to mid-June. During this stage, there were some sporadic cases with untraceable contact histories. To investigate the origin and transmission route of SARS-CoV in Taiwan's epidemic, we conducted a systematic viral lineage study by sequencing the entire viral genome from ten SARS patients. SARS-CoV viruses isolated from Taiwan were found closely related to those from Guangdong and Hong Kong. In addition, all cases from the second stage belonged to the same lineage after the municipal hospital outbreak, including the patients without an apparent contact history. Analyses of these full-length sequences showed a positive selection occurring during SARS-CoV virus evolution. The mismatch distribution indicated that SARS viral genomes did not reach equilibrium and suggested a recent introduction of the viruses into human populations. The estimated genome mutation rate was approximately 0.1 per genome, demonstrating possibly one of the lowest rates among known RNA viruses.
Figures
References
-
- Lee, N., Hui, D., Wu, A., Chan, P., Cameron, P., Joynt, G. M., Ahuja, A., Yung, M. Y., Leung, C. B., To, K. F., et al. (2003) N. Engl. J. Med. 348, 1986-1994. - PubMed
-
- Tsang, K. W., Ho, P. L., Ooi, G. C., Yee, W. K., Wang, T., Chan-Yeung, M., Lam, W. K., Seto, W. H., Yam, L. Y., Cheung, T. M., et al. (2003) N. Engl. J. Med. 348, 1977-1985. - PubMed
-
- Poutanen, S. M., Low, D. E., Henry, B., Finkelstein, S., Rose, D., Green, K., Tellier, R., Draker, R., Adachi, D., Ayers, M., et al. (2003) N. Engl. J. Med. 348, 1995-2005. - PubMed
-
- Drosten, C., Gunther, S., Preiser, W., van der Werf, S., Brodt, H. R., Becker, S., Rabenau, H., Panning, M., Kolesnikova, L., Fouchier, R. A., et al. (2003) N. Engl. J. Med. 348, 1967-1976. - PubMed
Publication types
MeSH terms
Substances
Associated data
- Actions
- Actions
- Actions
- Actions
- Actions
- Actions
- Actions
- Actions
- Actions
- Actions
- Actions
LinkOut - more resources
Full Text Sources
Miscellaneous
