. 2004 Feb 24;101(8):2560-5.
doi: 10.1073/pnas.0308577100.

Topographic specificity of functional connections from hippocampal CA3 to CA1

Affiliations

Topographic specificity of functional connections from hippocampal CA3 to CA1

Iman H Brivanlou et al. Proc Natl Acad Sci U S A. .

Abstract

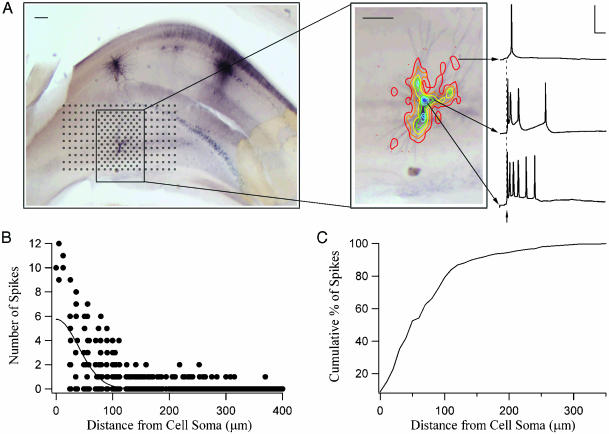
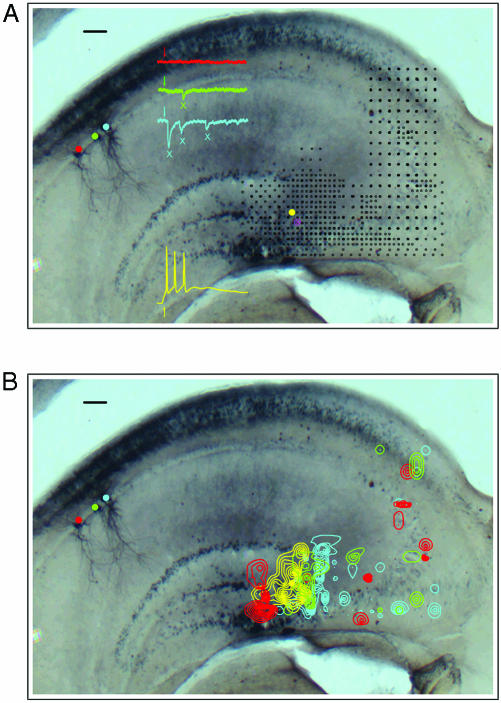
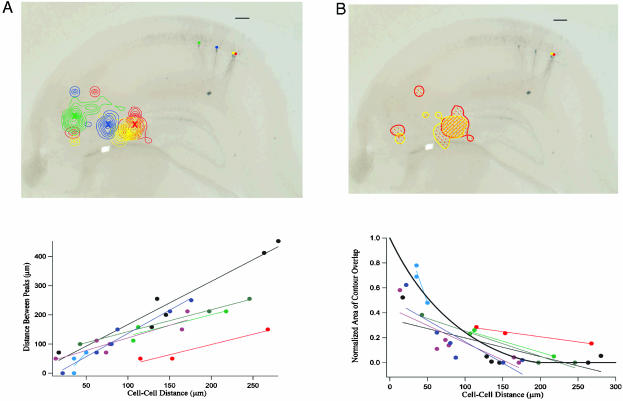
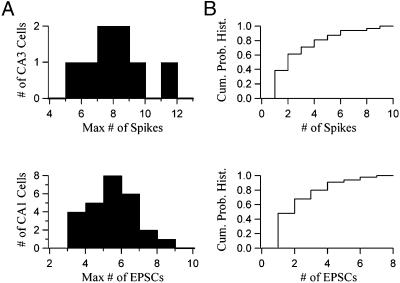
The hippocampus is a cortical region thought to play an important role in learning and memory. Most of our knowledge about the detailed organization of hippocampal circuitry responsible for these functions is derived from anatomical studies. These studies present an incomplete picture, however, because the functional character and importance of connections are often not revealed by anatomy. Here, we used a physiological method (photostimulation with caged glutamate) to probe the fine pattern of functional connectivity between the CA3 and CA1 subfields in the mouse hippocampal slice preparation. We recorded intracellularly from CA1 and CA3 pyramidal neurons while scanning with photostimulation across the entire CA3 subfield with high spatial resolution. Our results show that, at a given septotemporal level, nearby CA1 neurons receive synaptic inputs from neighboring CA3 neurons. Thus, the CA3 to CA1 mapping preserves neighbor relations.


Figures

Fig. 1.
Fig. 1.
(A) A representative mouse hippocampal slice with biocytin-stained CA3 pyramidal cell. The black markers represent sites over CA3 that were photostimulated (25 or 50 μm apart). (Inset) Contour plots depicting the spiking response profile for this CA3 cell. The contours were generated by counting the number of spikes; each contour line represents from one spike (red = 1) to seven spikes (dark blue = 7). (Scale bar, 100 μm.) Sample traces are shown for some contours on the right. (Scale, 50 ms and 50 mV.) (B) Number of spikes generated by three CA3 neurons as a function of photostimulation distance from each cell's soma. (C) Cumulative percentage of spikes generated as a function of distance between the photostimulation site and the cell soma for all recorded CA3 cells (n = 8).
Fig. 2.
Fig. 2.
(A) A mouse hippocampal slice with recordings from three CA1 cells (red, green, and blue) and one CA3 cell (yellow). The black markers represent sites over CA3 that were photostimulated (25 μm or 50 μm apart). Sample responses from each cell to photostimulation at a single site (yellow marker) are also shown. (B) Contour plots depicting the response profiles for each cell shown in A. The contours were generated from responses to stimulation of CA3 cell (shown in yellow). (Scale bar, 100 μm.)
Fig. 5.
Fig. 5.
(A) Distance between the location of the most prominent peaks of the CA3 input source regions for CA1 neurons plotted vs. intercellular distance in CA1 for each cell pair (see Methods). Neuronal pairs recorded from the same slice are shown in the same color. The best-fit lines for each slice data set are also included to show the trends. (B) Normalized area of contour overlap in the CA3 response profiles plotted versus intercellular distance in CA1 for each cell pair (see Methods). Neuronal pairs recorded from the same slice are shown in the same color. The best-fit lines for each slice data set are also included to show the trend. The thick black line represents the same overlap measure for two circles of diameter 200 μm as a function of the distance between their centers. (Scale bar, 100 μm.)
Fig. 3.
Fig. 3.
(A Upper) Histogram of the maximal number of elicited spikes from each CA3 cell on photostimulation at that cell's most responsive location (n = 8, average = 7.6). (A Lower) Histogram of the maximal number of measured EPSCs for each CA1 cell on photostimulation at that cell's best location in its primary source region (n = 26, average = 5.0). (B Upper) Cumulative probability histogram of the number of spikes elicited over all photostimulation locations for a representative CA3 cell. (B Lower) Cumulative probability histogram of the number of measured EPSCs over all photostimulation locations for a representative CA1 cell.
Fig. 4.
Fig. 4.
(A) Responses from two CA3 neurons in response to four photostimulations for each cell. (Scale, 50 ms and 20 mV.) (B) EPSCs from a CA1 neuron in response to multiple photostimulations at the same site in CA3. Arrow, onset of photostimulation. (Scale, 25 ms and 20 pA.) (C) Total charge transfer for a CA1 neuron as a function of the number of measured EPSCs for that cell. (Scale, 25 ms and 20 pA.)

References

    1. O'Keefe, J. & Dostrovsky, J. (1971) Brain Res. 34, 171-175. - PubMed
    1. Scoville, W. B. & Milner, B. (1957) J. Neuropsychiatry Clin. Neurosci. 12, 103-113. - PubMed
    1. Lorente de No, R. (1933) J. Psychol. Neurol. 45, 381-438.
    1. Andersen, P., Bliss. T. V. P. & Skrede, K. K. (1971) Exp. Brain Res. 13, 222-238. - PubMed
    1. Amaral, D. G. & Witter, M. P. (1989) Neuroscience 31, 571-591. - PubMed

LinkOut - more resources