Attention to features precedes attention to locations in visual search: evidence from electromagnetic brain responses in humans
- PMID: 14985422
- PMCID: PMC6730400
- DOI: 10.1523/JNEUROSCI.3564-03.2004
Attention to features precedes attention to locations in visual search: evidence from electromagnetic brain responses in humans
Abstract
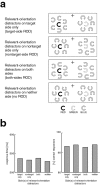
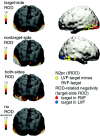
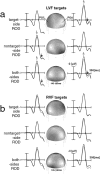
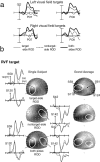
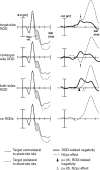
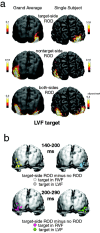
Single-unit recordings in macaque extrastriate cortex have shown that attentional selection of nonspatial features can operate in a location-independent manner. Here, we investigated analogous neural correlates at the neural population level in human observers by using simultaneous event-related potential (ERP) and event-related magnetic field (ERMF) recordings. The goals were to determine (1) whether task-relevant features are selected before attention is allocated to the location of the target, and (2) whether this selection reflects the locations of the relevant features. A visual search task was used in which the spatial distribution of nontarget items with attended feature values was varied independently of the location of the target. The presence of task-relevant features in a given location led to a change in ERP/ERMF activity beginning approximately 140 msec after stimulus onset, with a neural origin in the ventral occipito-temporal cortex. This effect was independent of the location of the actual target. This effect was followed by lateralized activity reflecting the allocation of attention to the location of the target (the well known N2pc component), which began at approximately 170 msec poststimulus. Current source localization indicated that the allocation of attention to the location of the target originated in more anterior regions of occipito-temporal cortex anterior than the feature-related effects. These findings suggest that target detection in visual search begins with the detection of task-relevant features, which then allows spatial attention to be allocated to the location of a likely target, which in turn allows the target to be positively identified.
Figures

Similar articles
-
Spatiotemporal dynamics of feature-based attention spread: evidence from combined electroencephalographic and magnetoencephalographic recordings.J Neurosci. 2012 Jul 11;32(28):9671-6. doi: 10.1523/JNEUROSCI.0439-12.2012. J Neurosci. 2012. PMID: 22787052 Free PMC article.
-
Neural mechanisms of surround attenuation and distractor competition in visual search.J Neurosci. 2011 Apr 6;31(14):5213-24. doi: 10.1523/JNEUROSCI.6406-10.2011. J Neurosci. 2011. PMID: 21471356 Free PMC article.
-
Selective attention to spatial frequency gratings affects visual processing as early as 60 msec. poststimulus.Percept Mot Skills. 2009 Aug;109(1):140-58. doi: 10.2466/PMS.109.1.140-158. Percept Mot Skills. 2009. PMID: 19831095
-
Event-related brain potentials in the study of visual selective attention.Proc Natl Acad Sci U S A. 1998 Feb 3;95(3):781-7. doi: 10.1073/pnas.95.3.781. Proc Natl Acad Sci U S A. 1998. PMID: 9448241 Free PMC article. Review.
-
A brief introduction to the use of event-related potentials in studies of perception and attention.Atten Percept Psychophys. 2010 Nov;72(8):2031-46. doi: 10.3758/APP.72.8.2031. Atten Percept Psychophys. 2010. PMID: 21097848 Free PMC article. Review.
Cited by
-
Separable mechanisms underlying global feature-based attention.J Neurosci. 2012 Oct 31;32(44):15284-95. doi: 10.1523/JNEUROSCI.1132-12.2012. J Neurosci. 2012. PMID: 23115167 Free PMC article.
-
Feature-selective attention enhances color signals in early visual areas of the human brain.Proc Natl Acad Sci U S A. 2006 Sep 19;103(38):14250-4. doi: 10.1073/pnas.0606668103. Epub 2006 Sep 6. Proc Natl Acad Sci U S A. 2006. PMID: 16956975 Free PMC article.
-
The time-course of component processes of selective attention.Neuroimage. 2019 Oct 1;199:396-407. doi: 10.1016/j.neuroimage.2019.05.067. Epub 2019 May 29. Neuroimage. 2019. PMID: 31150787 Free PMC article.
-
A common neural mechanism for preventing and terminating the allocation of attention.J Neurosci. 2012 Aug 1;32(31):10725-36. doi: 10.1523/JNEUROSCI.1864-12.2012. J Neurosci. 2012. PMID: 22855820 Free PMC article.
-
Differences between endogenous attention to spatial locations and sensory modalities.Exp Brain Res. 2017 Oct;235(10):2983-2996. doi: 10.1007/s00221-017-5030-4. Epub 2017 Jul 17. Exp Brain Res. 2017. PMID: 28717820 Free PMC article.
References
-
- American Electroencephalographic Society (1994) Guideline seven: a proposal for standard montages to be used in clinical EEG. American Electroencephalographic Society. J Clin Neurophysiol 11: 30-36. - PubMed
-
- Anllo-Vento L, Hillyard SA (1996) Selective attention to the color and direction of moving stimuli: electrophysiological correlates of hierarchical feature selection. Percept Psychophys 58: 191-206. - PubMed
-
- Arnott SR, Pratt J, Shore DI, Alain C (2001) Attentional set modulates visual areas: an event-related potential study of attentional capture. Brain Res Cogn Brain Res 12: 383-395. - PubMed
-
- Bichot NP, Cave KR, Pashler H (1999) Visual selection mediated by location: feature-based selection of noncontiguous locations. Percept Psychophys 61: 403-423. - PubMed
-
- Brefczynski JA, DeYoe EA (1999) A physiological correlate of the `spotlight' of visual attention. Nat Neurosci 2: 370-374. - PubMed
Publication types
MeSH terms
Grants and funding
LinkOut - more resources
Full Text Sources
