. 2004 Feb 25;24(8):1888-96.
doi: 10.1523/JNEUROSCI.3809-03.2004.

Clearance of alpha-synuclein oligomeric intermediates via the lysosomal degradation pathway

Affiliations

Clearance of alpha-synuclein oligomeric intermediates via the lysosomal degradation pathway

He-Jin Lee et al. J Neurosci. .

Abstract

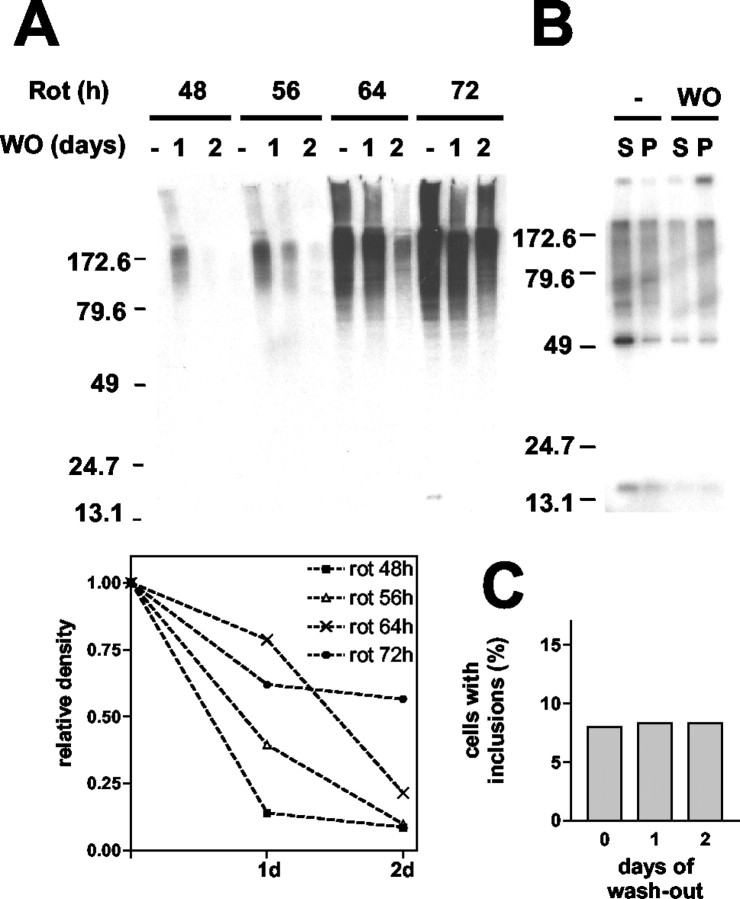
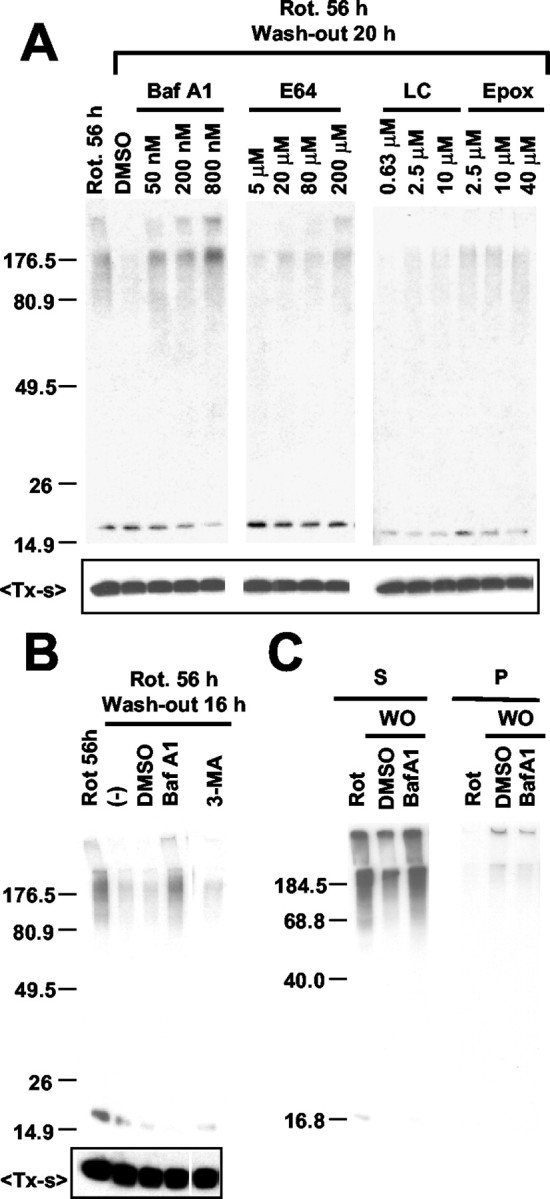
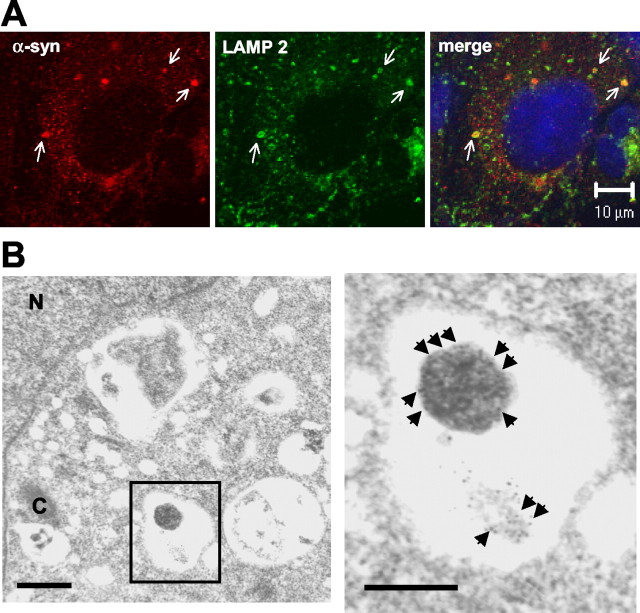
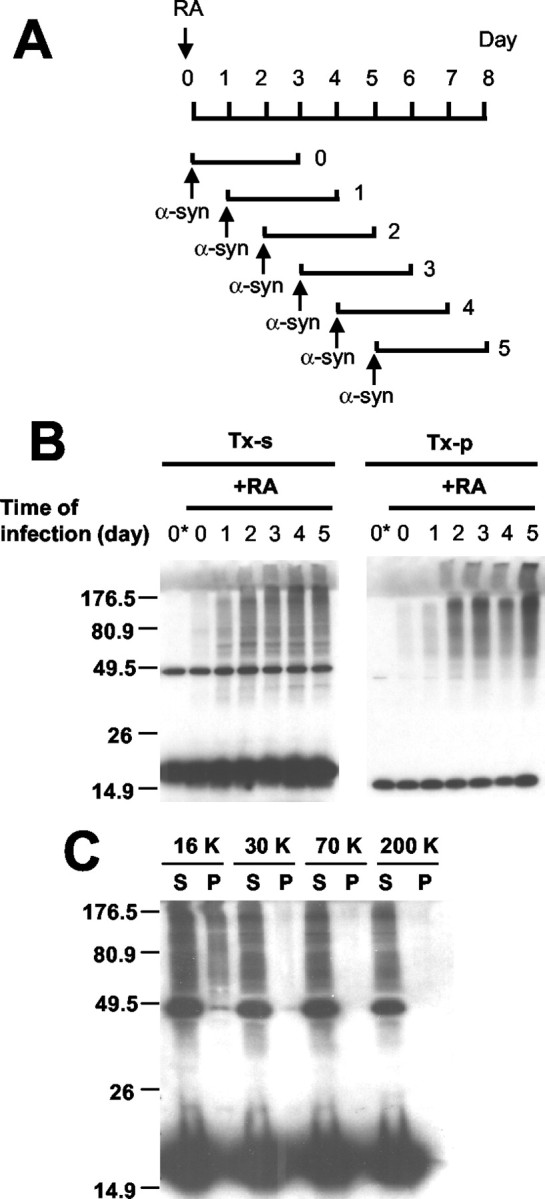
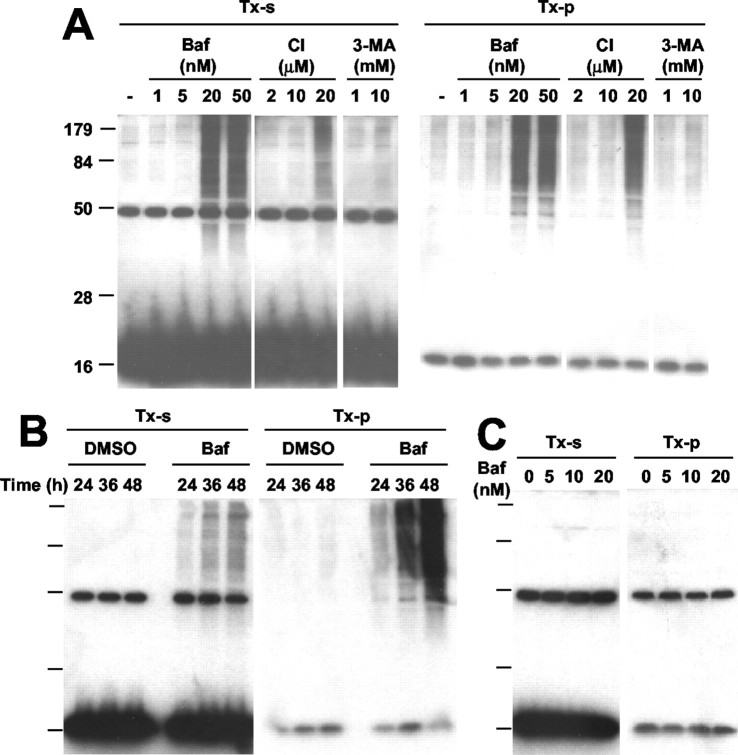
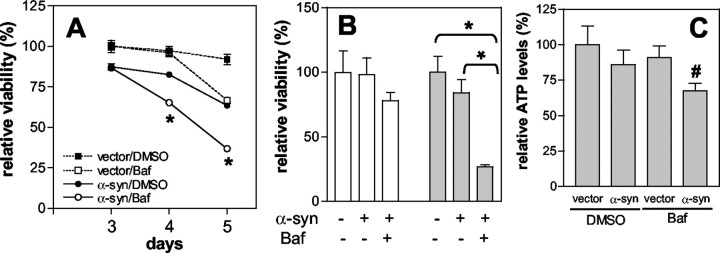
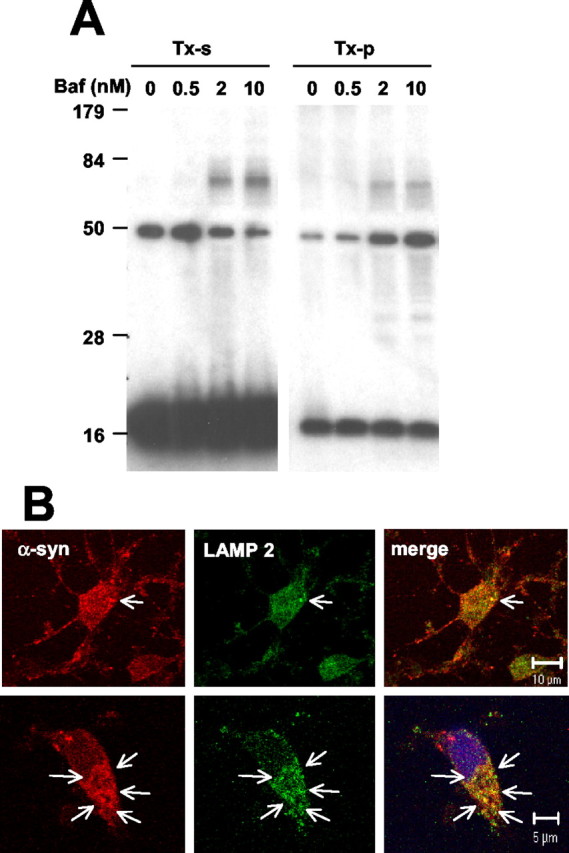
Cytoplasmic deposition of alpha-synuclein aggregates is a common pathological feature of many neurodegenerative diseases. Strong evidence for the causative role of alpha-synuclein in these disorders is provided by genetic linkage between this gene and familial Parkinson's disease and by neurodegeneration in transgenic animals that overexpress this protein. In particular, it has been hypothesized that the accumulation of nonfibrillar oligomers of alpha-synuclein, which serve as intermediates for fibrillar inclusion body formation, causes neurodegeneration. However, little is known about how cells handle potentially toxic protein aggregates. Here we demonstrate that cells are capable of clearing preformed alpha-synuclein aggregates via the lysosomal degradation pathway. Consequently, blocking this pathway causes the accumulation of the aggregates in non-neuronal cells, differentiated neuroblastoma cells, and primary cortical neurons. This aggregate clearance occurs in an aggregation stage-specific manner; oligomeric intermediates are susceptible to clearance, whereas mature fibrillar inclusion bodies are not. Neutralization of the acidic compartments leads to the accumulation of alpha-synuclein aggregates and exacerbates alpha-synuclein toxicity in postmitotic neuronal cells, suggesting that the accumulation of oligomeric intermediates may be an important event leading to alpha-synuclein-mediated cell death. These results suggest that enhancing lysosomal function may be a potential therapeutic strategy to halt or even prevent the pathogenesis of Parkinson's disease and other Lewy body diseases.


Figures

Figure 1.
Figure 1.
Clearance of α-synuclein oligomeric intermediates. COS-7 cells expressing α-syn were treated with 100 nm rotenone for the indicated times and then incubated in fresh medium without rotenone for 1 or 2 d. A, Cells were extracted with PBS/1% Triton X-100, and the Triton-insoluble fractions were analyzed by Western blotting. The bottom panel shows densitometric analysis of the Western data. The relative density is obtained by calculating the percentage of remaining aggregates after the rotenone washout. B, Oligomeric intermediates (S) and mature fibrillar inclusion bodies (P) were separated before (-) and 1 d after (WO) the rotenone washout and were analyzed by Western blotting. C, Quantitation of the number of mature inclusion bodies. Before and after the rotenone washout the cells were fixed and labeled for α-syn by immunofluorescence. Cells with mature juxtanuclear inclusion bodies were counted in six different randomly selected areas, and the number of these cells was divided by the number of nuclei to obtain the percentage.
Figure 2.
Figure 2.
The mechanism of α-syn aggregate clearance. COS-7 cells expressing α-syn were treated with 100 nm rotenone for 56 hr, followed by rotenone washout. A, Lysosomal and proteasomal inhibitors were added at the indicated concentrations during the rotenone washout. B, During the rotenone washout COS-7 cells were treated with Baf (200 nm) or 3-MA (10 mm); (-) indicates no-treatment control. DMSO was treated as a vehicle control for Baf. C, After 16 hr of the rotenone washout (WO) in the presence of DMSO or Baf, oligomeric aggregates (S) and mature inclusion bodies (P) were separated and analyzed by Western blotting. In A and B, the top panels show Triton-insoluble aggregates, and the bottom panels show monomers in the Triton-soluble fractions (TX-s).
Figure 3.
Figure 3.
Localization of α-syn aggregates in the lysosomes. A, COS-7 cells expressing α-syn were treated with 100 nm rotenone for 56 hr, followed by incubation in rotenone-free medium. Cells were fixed and labeled with antibodies for α-syn (red) and LAMP 2 (green). Arrows indicate α-syn aggregates captured within LAMP 2-positive compartments. Nuclei were stained with Hoechst 33258 (blue). B, EM analysis of COS-7 cells with α-syn aggregates. α-Syn aggregates are visualized by 10 nm gold-conjugated secondary antibody. Boxed area is magnified on the right. Scale bars: left, 0.4 μm; right, 0.2 μm. Arrowheads indicate immunogold particles that label spherical and amorphous aggregates in a vacuolar structure. The amorphous aggregate may represent ongoing degradation. N, Nucleus; C, centrosome.
Figure 4.
Figure 4.
α-Synuclein aggregation in differentiated human neuroblastoma cells. A, Schematic presentation of differentiation and α-synuclein expression. α-Synuclein is expressed for 3 d in cells at different stages of differentiation. B, Western analysis of α-synuclein aggregation. The first lane (0*) of each panel shows the naive SH-SY5Y cells infected and processed in the same way. Note that the level of α-synuclein aggregation increases with a longer period of differentiation in both Triton-soluble (TX-s) and Triton-insoluble (TX-p) fractions. C, Sedimentation analysis of α-syn aggregates. Detergent extract of differentiated SH-SY5Y cells overexpressing α-syn was subjected to a sequential differential centrifugation. Cells were treated with 20 nm Baf before the extraction to enrich the aggregates (see Fig. 5). Numbers at the top indicate the centrifugal forces in gravity (g). S and P indicate the supernatant and the pellet of each centrifugation, respectively.
Figure 5.
Figure 5.
Lysosomal inhibitors stabilize α-syn aggregates in differentiated SH-SY5Y cells. A, Differentiated SH-SY5Y cells overexpressing α-syn were treated with Baf, cathepsin inhibitor I, or 3-MA for 24 hr at the indicated concentrations. Triton-soluble (TX-s) and Triton-insoluble (TX-p) fractions were obtained from cell extracts and analyzed by Western blotting. B, Progressive accumulation of aggregates in differentiated SH-SY5Y after treatment with 20 nm Baf. C, Baf treatment does not lead to aggregate accumulation in undifferentiated SH-SY5Y cells.
Figure 6.
Figure 6.
Overlap between α-syn punctate pattern and LAMP 2 in differentiated SH-SY5Y cells. Cells overexpressing α-syn were treated with 4 μm cathepsin inhibitor I for 24 hr and labeled with antibodies for α-syn (red) and LAMP 2 (green). Arrows indicate granular α-syn stains that overlap with LAMP 2-positive compartments. Nuclei were stained with Hoechst 33258 (blue).
Figure 7.
Figure 7.
Lysosomal inhibition exacerbates α-syn-induced cytotoxicity. A, Differentiated SH-SY5Y cells were infected with empty control vector (dotted lines) or adeno/α-syn (solid lines) and were treated with DMSO (filled symbols) or 10 nm Baf (open symbols) on day 2 after infection. Cell viability was measured on days 3, 4, and 5 after infection, using the MTS reduction assay. To obtain relative viability, we used data from empty vector-infected cells on day 3 as a reference. B, Trypan blue exclusion assay. Cells were treated with 10 nm Baf on day 2 after infection, and live cell numbers were obtained on days 3 (white bars) and 4 (gray bars). C, ATP measurement. Cells were treated with 10 nm Baf, and ATP levels were measured on day 4. A, B, n = 3; C, n = 5. Error bars represent SEM. Statistical significance was assessed by one-way ANOVA and is indicated with *p < 0.01 and #p < 0.05.
Figure 8.
Figure 8.
Accumulation of α-syn oligomers in rat cortical neurons. A, Neurons (DIV 11) were treated with Baf at the indicated concentrations for 24 hr. Endogenous α-syn in the Triton-soluble (TX-s) and Triton-insoluble (TX-p) fractions was analyzed by Western blotting. B, DIV 11 cortical neurons were treated with the mixture of serine, cysteine, and aspartic protease inhibitors for 2 hr (top images) and 4 hr (bottom images) and fluorescently labeled for α-syn (red) and LAMP 2 (green). Arrows indicate the colocalization between α-syn and LAMP 2. Nuclei were stained with Hoechst 33258 (blue).

Similar articles

Cited by

References

    1. Anglade P, Vyas S, Javoy-Agid F, Herrero MT, Michel PP, Marquez J, Mouatt-Prigent A, Ruberg M, Hirsch EC, Agid Y (1997) Apoptosis and autophagy in nigral neurons of patients with Parkinson's disease. Histol Histopathol 12: 25-31. - PubMed
    1. Bahr BA, Bendiske J (2002) The neuropathogenic contributions of lysosomal dysfunction. J Neurochem 83: 481-489. - PubMed
    1. Bendiske J, Caba E, Brown QB, Bahr BA (2002) Intracellular deposition, microtubule destabilization, and transport failure: an “early” pathogenic cascade leading to synaptic decline. J Neuropathol Exp Neurol 61: 640-650. - PubMed
    1. Bennett MC, Bishop JF, Leng Y, Chock PB, Chase TN, Mouradian MM (1999) Degradation of α-synuclein by proteasome. J Biol Chem 274: 33855-33858. - PubMed
    1. Biederbick A, Kern HF, Elsasser HP (1995) Monodansylcadaverine (MDC) is a specific in vivo marker for autophagic vacuoles. Eur J Cell Biol 66: 3-14. - PubMed

Publication types

MeSH terms