. 2004 Feb 25;24(8):1976-86.
doi: 10.1523/JNEUROSCI.1670-03.2004.

L1/Laminin modulation of growth cone response to EphB triggers growth pauses and regulates the microtubule destabilizing protein SCG10

Affiliations

L1/Laminin modulation of growth cone response to EphB triggers growth pauses and regulates the microtubule destabilizing protein SCG10

Leejee H Suh et al. J Neurosci. .

Abstract

During development, EphB proteins serve as axon guidance molecules for retinal ganglion cell axon pathfinding toward the optic nerve head and in midbrain targets. To better understand the mechanisms by which EphB proteins influence retinal growth cone behavior, we investigated how axon responses to EphB were modulated by laminin and L1, two guidance molecules that retinal axons encounter during in vivo pathfinding. Unlike EphB stimulation in the presence of laminin, which triggers typical growth cone collapse, growth cones co-stimulated by L1 did not respond to EphB. Moreover, EphB exposure in the presence of both laminin and L1 resulted in a novel growth cone inhibition manifested as a pause in axon elongation with maintenance of normal growth cone morphology and filopodial activity. Pauses were not associated with loss of growth cone actin but were accompanied by a redistribution of the microtubule cytoskeleton with increased numbers of microtubules extending into filopodia and to the peripheral edge of the growth cone. This phenomenon was accompanied by reduced levels of the growth cone microtubule destabilizing protein SCG10. Antibody blockade of SCG10 function in growth cones resulted in both changes in microtubule distribution and pause responses mirroring those elicited by EphB in the presence of laminin and L1. These results demonstrate that retinal growth cone responsiveness to EphB is regulated by co-impinging signals from other axon guidance molecules. Furthermore, the results are consistent with EphB-mediated axon guidance mechanisms that involve the SCG10-mediated regulation of the growth cone microtubule cytoskeleton.


Figures

Figure 1.
Figure 1.
Pause behavior in growth cones. A, Time-lapse sequence of embryonic mouse retinal growth cones extending on L1 substratum and their response to EphB-Fc. Time elapsed (in minutes) is shown in the top right of panels. “0” represents onset of EphB-Fc application via micropipette (asterisk). EphB did not affect axon growth. Scale bar, 10 μm. B, Trajectories of axons on L1-Fc after EphB-Fc exposure. The arrows bracket the angles of pipette placement with respect to orientation of axons tested. The area containing all axon trajectories is shaded gray. EphB-Fc exposure did not produce a growth bias toward or away from the pipette. C, EphB-Fc binding on retinal growth cone on L1. D, Anti-Nckβ immunostaining of retinal growth cone on L1. E, Time-lapse sequence of growth cones on L1-Fc substratum responding to pipette application of EphB-Fc and laminin peptides at t = 0. Growth cones showed a pause behavior characterized by no forward advance but continued filopodia and lamellapodia activity. F, Time-lapse sequence of a paused growth cone resuming forward elongation after reagent removal at 60 min. [The growth cone pauses with continued filopodial activity described in this study were distinct from a previously reported growth cone freezing phenomenon (Birgbauer et al., 2001). Growth cone freezing was characterized by total loss of filopodial movements and occurred at low frequency after retinal growth cones on laminin were exposed to either EphB or control Fc proteins.]
Figure 2.
Figure 2.
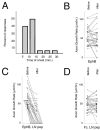
Characterization of growth cone responses. A, Graph showing the time interval (in minutes) between the application of EphB proteins and onset of pause response in retinal growth cones (n = 85). The percentage of responses that occurred within each 5 min interval between 0 and 30 min is plotted. The mean onset time for retinal growth cones extending on L1 and laminin and exposed to EphB proteins (12 ± 6 min; n = 17) was not significantly different from that for growth cones on L1 exposed to EphB and laminin peptides by micropipette (11 ± 6 min; n = 50) or for growth cones on L1 exposed to EphB and laminin peptides by bath application (10 ± 7 min; n = 18). B, Graph showing growth rates of axons extending on L1 before and after exposure to EphB. A solid line links the growth rates for each axon before and after reagent exposure. C, Graph showing growth rates of axons extending on L1 before and after exposure to EphB and laminin peptides. A solid line links the growth rates for each axon before and after reagent exposure. Growth rates of zero after reagent exposure represent paused growth cones. Axons extending on L1 with growth rates of 40 μm/hr, as well as those of >100 μm/hr, exhibited pauses after exposure to EphB and laminin peptides. D, Graph showing growth rates of axons extending on L1 before and after exposure to Fc and laminin peptides.
Figure 3.
Figure 3.
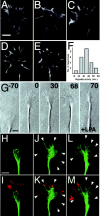
Distribution of actin and microtubules, filopodial activity, and LPA-induced collapse in paused growth cones. A, Texas Red phalloidin staining of actin distribution in a normal growth cone on L1. Scale bars: A-E, 5 μm. B-E, Actin was present at the periphery and in filopodia of growth cones on L1 after EphB and laminin peptide exposure for 10 min (B, C) and 30 min (D, E). F, The duration of filopodial activity in paused growth cones. Between 10 and 60 min, the number of growth cones that ceased filopodial activity in each 10 min interval is plotted. Growth cones typically did not collapse even after cessation of filopodial activity. G, Time-lapse sequence of LPA treatment on a paused growth cone. LPA was applied at 65 min and triggered growth cone collapse within 5 min. Scale bar, 5 μm. H, Distribution of tyrosinated microtubules (green) in a normal growth cone on L1. I, Microtubules (green) and actin (red) in the same growth cone in L showing the segregation of microtubules into the central part of the growth cone and actin into the growth cone periphery and in filopodia. J, Microtubules in a growth cone on L1 after exposure to EphB-Fc and laminin peptides. Note long curved microtubules (arrowheads) that extended into the periphery and filopodia. K, Colocalization of actin and microtubules in the growth cone shown in J. L, Microtubules in a second growth cone on L1 after exposure to EphB-Fc and laminin peptides. Long curved microtubules (arrowheads) were present and extended into the periphery and some filopodia. M, Colocalization of actin and microtubules in the growth cone shown in L. Scale bars: H-M, 5 μm. The actin distribution in the growth cones shown in H, J, and L is shown in A-C.
Figure 4.
Figure 4.
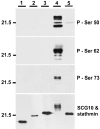
Immunoblot analysis of SCG10 phospho-antibodies on 14% SDS-PAGE. Protein loading: Lane 1, Unphosphorylated SCG10 produced in E. coli (35 ng); lane 2, stathmin produced in E. coli; lane 3, stathmin produced in baculovirus; lane 4, phosphorylated SCG10 expressed in COS-7 cells (5 μg); lane 5, protein extract from COS-7 cells (5 μg). Phosphorylated SCG10 produced in COS-7 cells (lane 4) is recognized by anti-phosphoserine 50 (P-Ser 50), anti-phosphoserine 62 (P-Ser 62), and anti-phosphoserine 73 (P-Ser 73) antibodies. The SCG10 protein and its phosphoforms migrate as multiple bands of ∼23-25 kDa. The smaller bands seen with P-Ser 50 and P-Ser 62 antibodies might correspond to degradation forms. The phospho-antibodies do not recognize unphosphorylated SCG10 produced in E. coli (lane 1), stathmin produced in E. coli (lane 2) or in baculovirus (lane 3), or stathmin in COS-7 cell extracts (lane 5), except that the P-Ser 50 antibody shows a very faint cross-reactivity. A parallel Western blot (bottom panel) with identical loading (except that only 0.5 μg of COS-7 cell extract was loaded on lane 4) was performed with nonpurified SCG10 antiserum, which recognizes both SCG10 and stathmin.
Figure 5.
Figure 5.
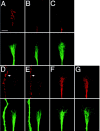
Regulators of growth cone microtubule assembly. The distribution of microtubules in each growth cone is shown in the bottom panel in green. Scale bars: A-G, = 5 μm. A, SCG10 in normal growth cones on L1 was present as punctate aggregates in the central domain (top), co-extensive with microtubules (bottom). B, Serine 62-phosphorylated SCG10 was normally present in the axon shaft but almost completely absent in growth cones. C, Growth cones exposed to L1, laminin, and EphB did not show an increase in SCG10 serine 62 phosphorylation. The microtubule array in this growth cone (bottom) was enlarged and disorganized, indicating that the characteristic pause behavior had occurred. D, Growth cones exposed to L1, laminin, and EphB showed decreased levels of SCG10 (detected using an antibody against SCG10 C-terminal peptide). SCG10 remained in the axon shaft on the left (arrow). Changes in SCG10 occurred before alterations in microtubules (bottom). E, Decreased levels of growth cone SCG10 (detected using antisera against SCG10 recombinant protein) after exposure to L1, laminin, and EphB. SCG10 remained in the axon shaft on the left (arrow). F, MAP1B was present in the central domain of normal growth cones extending on L1. G, Growth cones exposed to L1, laminin, and EphB showed no obvious changes in MAP1B distribution.
Figure 6.
Figure 6.
Quantitation of SCG10 and MAP1B levels in growth cones. A, SCG10 in retinal growth cones on L1. B, SCG10 in retinal growth cones on L1 treated with bath-applied EphB2-Fc and laminin peptides. These two populations of growth cones showed a statistically significant difference in mean SCG10 levels in a two-sample Wilcoxon test (see Results for details). C, MAP1B in retinal growth cones on L1. D, MAP1B in retinal growth cones on L1 treated with bath-applied EphB2-Fc and laminin peptides. These two populations of growth cones did not show a statistically significant difference in mean MAP1B levels in a two-sample Wilcoxon test (see Results).
Figure 7.
Figure 7.
Anti-SCG10 mAb inhibition of SCG10-mediated microtubule disassembly: ○, assembly of tubulin subunits into microtubules; •, SCG10 in the micromolar range completely blocked microtubule polymerization; ▪, the addition of equimolar amounts of anti-SCG10 mAb with SCG10 restored tubulin polymerization and microtubule formation to control levels (between 65 and 100% of control levels in 4 independent experiments); □, addition of control IgG (purified mouse IgG from Sigma) to SCG10 had no effect on the ability of SCG10 to inhibit microtubule assembly. IgG or SCG10 mAb alone had no effect (data not shown).
Figure 8.
Figure 8.
Perturbation of SCG10 function in growth cones. A, Growth cone on L1 loaded with anti-SCG10 polyclonal antibody using the lipid-based protein delivery reagent Bioporter. SCG10 was visualized with anti-rabbit secondary antibody and detected in its normal location in the central growth cone region. B, Growth cone on L1 loaded with anti-microtubule antibody conjugated with Alexafluor 488. C, Bright-field image of two growth cones 67 min after loading with Cy2 secondary antibody. Scale bars: C-E, 5 μm. D, Fluorescence image of the same growth cone pair in 3C, confirming loading of secondary antibody. E, The same growth cones at 121 min, indicating normal axon growth after control antibody loading. F, Time-lapse sequence of a growth cone loaded with anti-SCG10 function-blocking mAb. The growth cone maintained filopodial and lamellapodial activity but has paused in its forward elongation. Time (in minutes) after application of anti-SCG10 mAb is indicated at top right. Scale bar, 5 μm. G, Appearance of tyrosinated microtubules in the growth cone shown in F.

Similar articles

Cited by

References

    1. Antonsson B, Montessuit S, Di Paolo G, Lutjens R, Grenningloh G (1997) Expression, purification, and characterization of a highly soluble N-terminal-truncated form of the neuron-specific membrane-associated phosphoprotein SCG10. Protein Expr Purif 9: 295-300. - PubMed
    1. Antonsson B, Kassel DB, Di Paolo G, Lutjens R, Riederer BM, Grenningloh G (1998) Identification of in vitro phosphorylation sites in the growth cone protein SCG10. Effect Of phosphorylation site mutants on microtubule-destabilizing activity. J Biol Chem 273: 8439-8446. - PubMed
    1. Antonsson B, Kassel DB, Ruchti E, Grenningloh G (2001) Differences in phosphorylation of human and chicken stathmin by MAP kinase. J Cell Biochem 80: 346-352. - PubMed
    1. Bartsch U, Kirchhoff F, Schachner M (1989) Immunohistochemical localization of the adhesion molecules L1, N-CAM, and MAG in the developing and adult optic nerve of mice. J Comp Neurol 284: 451-462. - PubMed
    1. Birgbauer E, Cowan CA, Sretavan DW, Henkemeyer M (2000) Kinase independent function of EphB receptors in retinal axon pathfinding to the optic disc from dorsal but not ventral retina. Development 127: 1231-1241. - PubMed

Publication types

MeSH terms

LinkOut - more resources