. 2004 Feb 25;24(8):2004-12.
doi: 10.1523/JNEUROSCI.4080-03.2004.

Monitoring clathrin-mediated endocytosis during synaptic activity

Affiliations

Monitoring clathrin-mediated endocytosis during synaptic activity

Veronika J Mueller et al. J Neurosci. .

Abstract

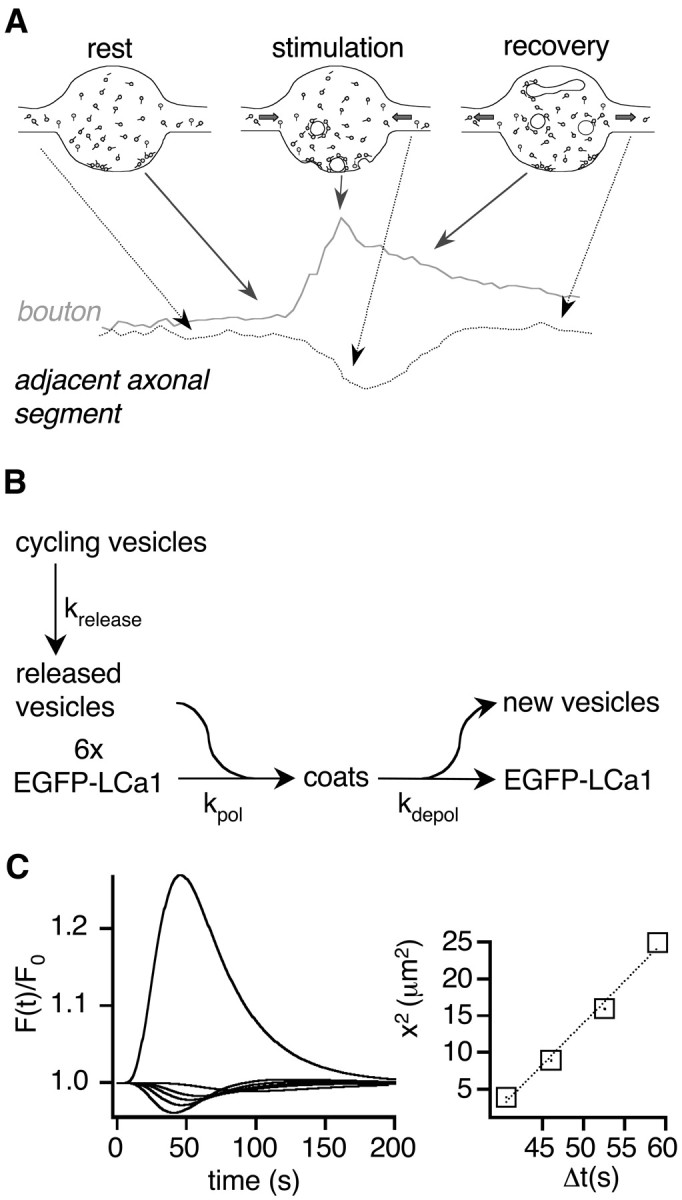
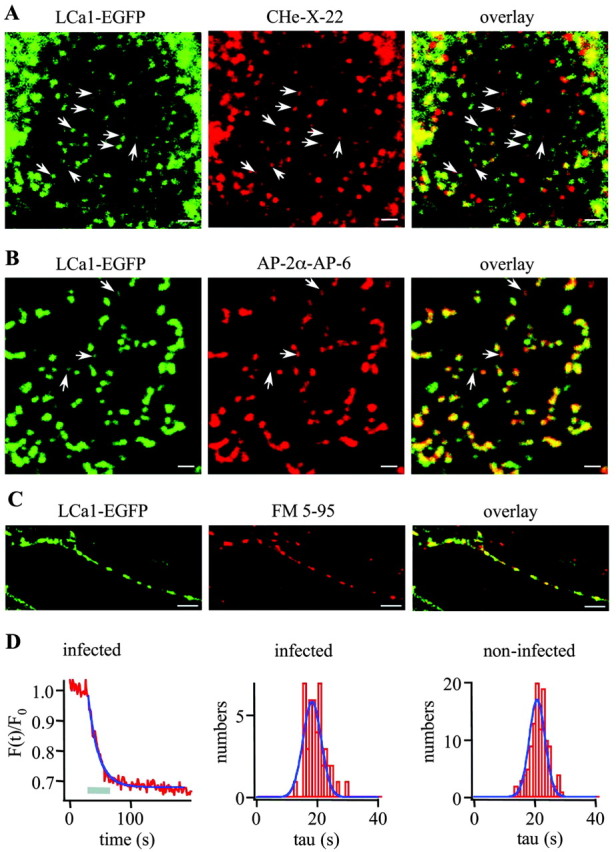
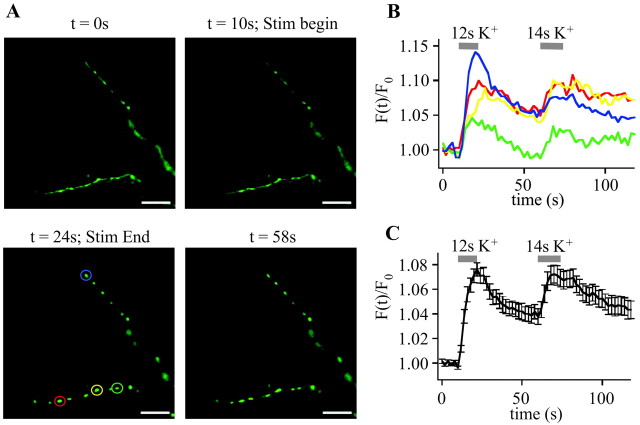
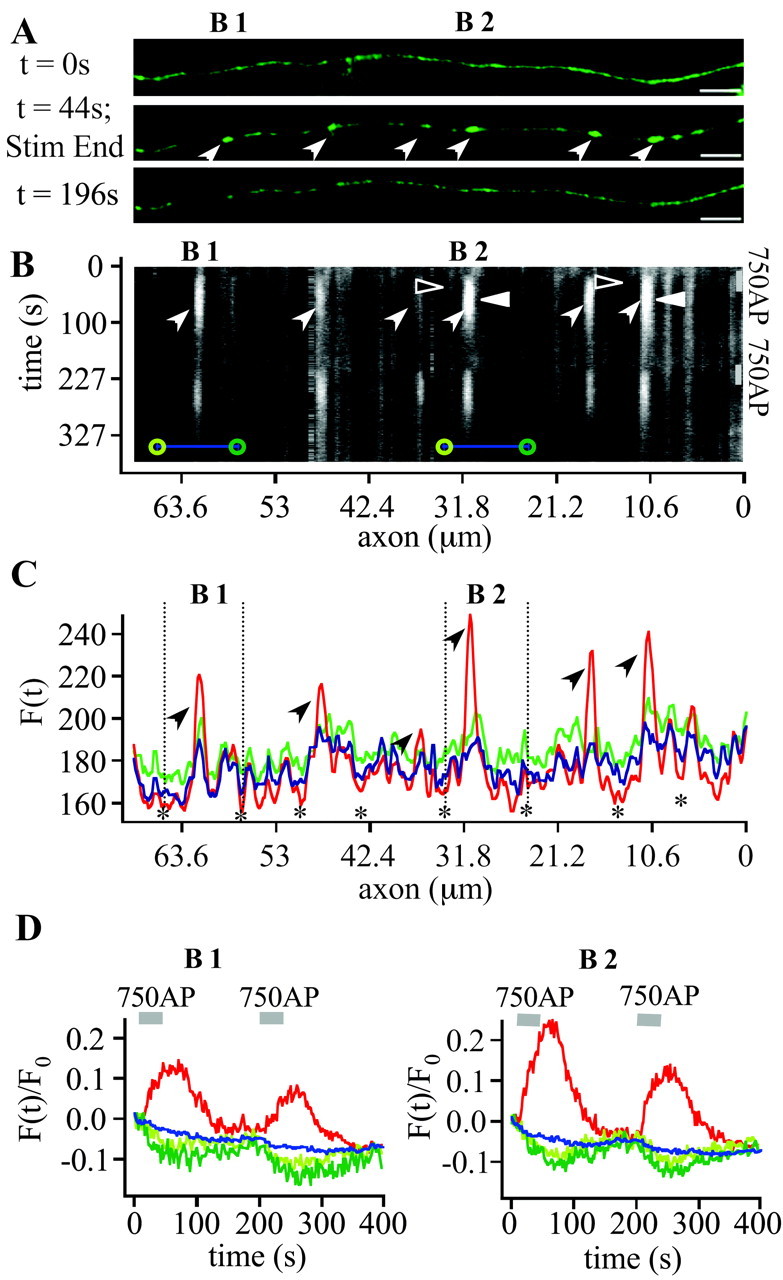
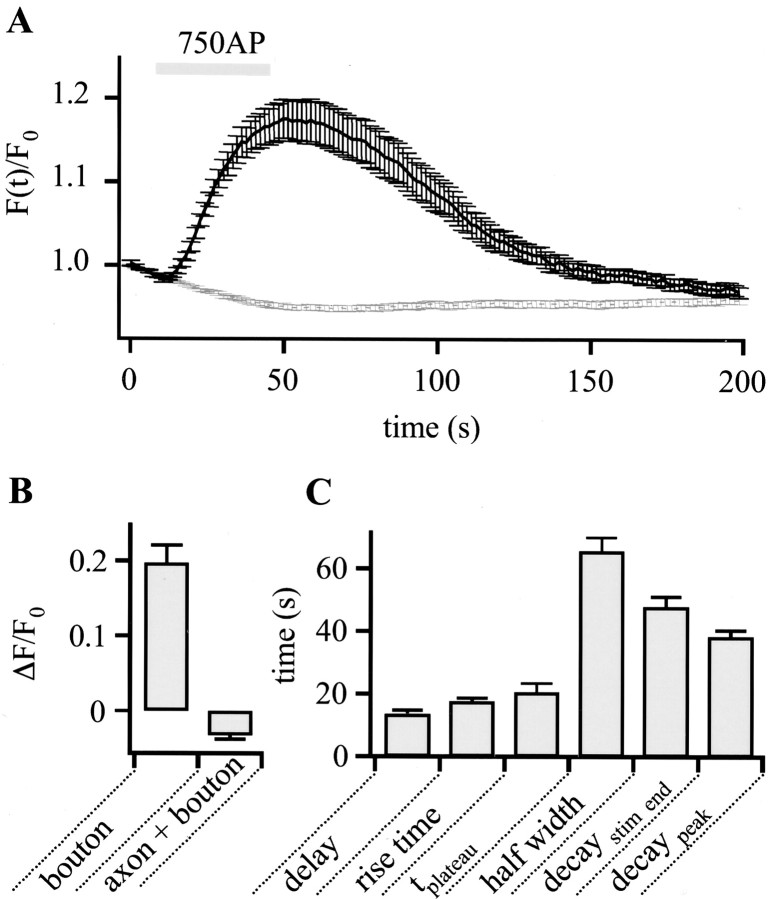
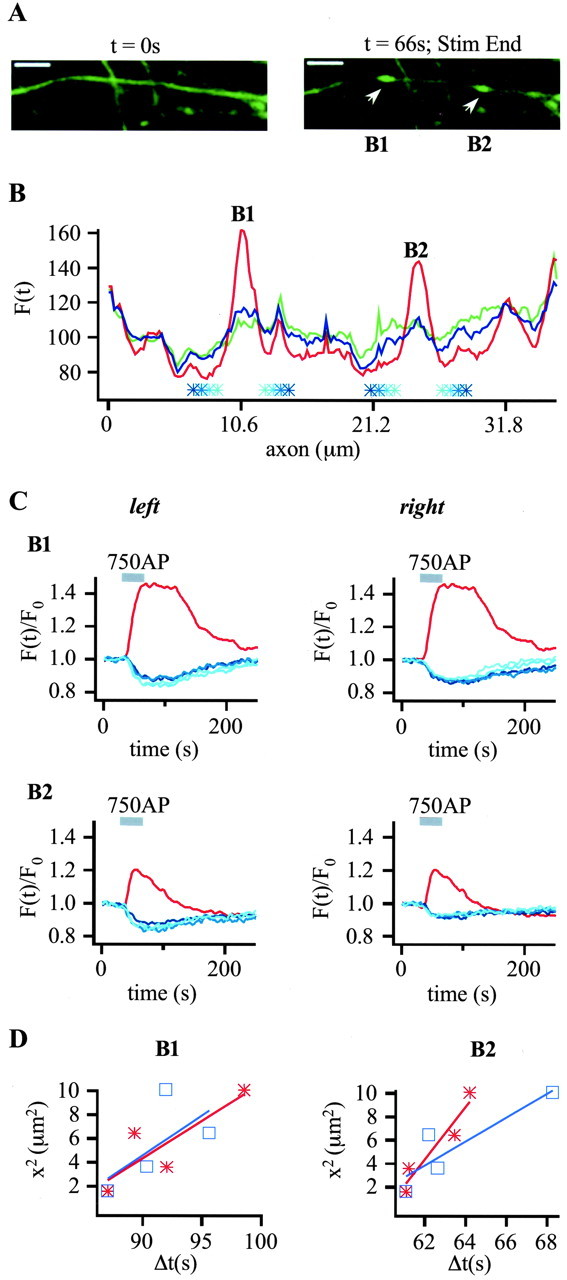
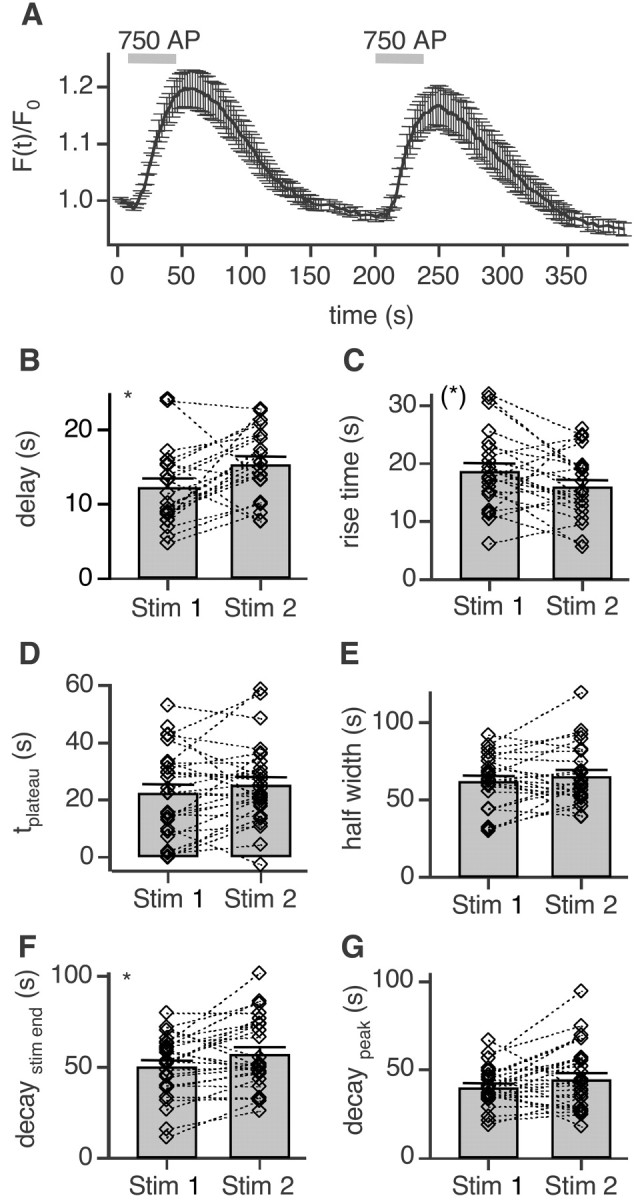
To visualize clathrin redistribution during endocytosis in hippocampal boutons, we used a fusion protein of clathrin light chain with enhanced green fluorescent protein. Both high potassium and electric field stimulation lead after a stimulus-dependent delay to a transient increase of fluorescence in synapses, but a slight and transient decrease in adjacent axonal segments. We conclude that the rise and fall of the signal in boutons, with decay kinetics remarkably similar to previous estimates of the endocytic time course, reflects coat assembly and disassembly. Thus, we could selectively measure clathrin-mediated endocytosis and separate its kinetics from other modes of membrane retrieval in CNS synapses. A long-lasting delay preceding the fluorescent transients shows that endocytosis during the first few seconds of continuing stimulation cannot be mediated by newly formed clathrin-coated pits. Therefore, a fast mode of endocytosis is either clathrin-independent or involves preassembled (easily retrievable) clathrin lattices at sites of endocytosis.


Figures

Figure 5.
Figure 5.
Reaction-diffusion model for transient EGFP-LCa1 signals during stimulation. A, A simple reaction-diffusion model explains the transient increase and decrease of EGFP-LCa1 signals in the bouton (gray) and adjacent axonal segments (black). Accumulation of EGFP-LCa1 in boutons caused by coat formation during stimulation leads to a decrease of free EGFP-LCa1. Therefore, EGFP-LCa1 diffuses from adjacent axonal segments into boutons leading to a decrease of the fluorescence in the axon. Thus, the bouton signal is directly proportional to the number of clathrin-coated pits at any given time point, provided that EGFP-LCa1 diffusion is significantly faster than coat assembly. B, Scheme of simplified reaction-diffusion model (also see Results). Vesicles are released from the cycling pool (= 100%) during stimulation with rate krelease; new coats are formed around these vesicles at a rate kpol (six sequential binding steps were sufficient to explain the measured delay of ∼10 sec) and after fission shed off clathrin at a rate kdepol. Polymerization creates a concentration sink of free LCa1-EGFP molecules leading to diffusional influx, whereas depolymerization creates a source for diffusion. C, A typical model simulation of fluorescence transients in a bouton and at distances 1, 2, 3, and 4 μm from the bouton is shown. Parameters were: krelease = 0.05 sec-1, kpol = 0.33 μm/sec-1, kdepol = 0.033 sec-1, DEGFP-LCa1 = 0.25 μm2/sec. Reaction constants were chosen to reflect an affinity according to the literature (Ungewickell, 1983), kdepol was estimated from FRAP experiments on single coated pits in HEK cells transfected with LCa1-EGFP (unpublished data). The release rate reflects the destaining characteristics for this stimulus paradigm (Fig. 1). D, The squared distances, i.e., square displacements, of the axonal transients in C are plotted versus the times of fluorescence minima. This yields a line with a slope of ∼5 times the diffusion constant. This factor of 5 is used as the proportionality factor for estimating the local axoplasmic diffusion constant for EGFP-LCa1 in Figure 6D.
Figure 1.
Figure 1.
EGFP-LCa1 is incorporated into coated pits and does not impair synaptic exo-endocytic vesicle cycling. A, B, HEK cells overexpressing EGFP-LCa1 (left) were fixed and immunolabeled either with an antibody against clathrin heavy chain (CHe-X-22; A, middle) or adaptor-binding protein 2 (AP-2α-AP-6; B, middle). Confocal images were taken in a region close to the cell surface. In both cases, colocalization was observed (A, B, right). Note, in some examples (arrows, especially in the top panels) colocalization is less obvious in the overlay because of highly differing signal intensities. Scale bars, 1 μm. C, Hippocampal axon expressing EGFP-LCa1 (green) was loaded with FM 5-95 (red) during a train of 750 APs. A clear colocalization between FM 5-95 spots and locations of slightly concentrated EGFP-LCa1 was obtained, indicating that EGFP-LCa1-expressing terminals are functionally intact. Scale bars, 5 μm. During electric field stimulation (750 APs at 20 Hz) FM 5-95 was released in an exemplar EGFP-LCa1-positive bouton (D, left) with a time constant of 16.9 sec and on average with a time constant of 18.3 ± 0.64 sec (D, middle, n = 44). Similar results were obtained in two other experiments [1: τmean = 17.04 ± 0.59 sec (n = 67); 2: τmean = 23.07 ± 0.96 sec (n = 35)]. The average time constant in noninfected cells was 20.7 ± 0.34 sec (D, right, n = 115). Similar results were obtained in two other experiments [1: τmean = 18.7 ± 0.55 sec (n = 50); 2: τmean = 16.5 ± 0.605 sec (n = 61)].
Figure 2.
Figure 2.
EGFP-LCa1 dynamics during high-K+ stimulation. A, Time-lapse series of EGFP-LCa1-positive axons from hippocampal neurons challenged with two pulses of high potassium (90 mm) at t = 10 and 60 sec. Under resting conditions (t = 0 sec) and at stimulus onset (t = 10 sec) synaptic boutons of EGFP-LCa1-positive axons are only slightly brighter than interconnecting axonal segments. During a 14 sec high-potassium challenge, numerous single presynaptic boutons showed transient fluorescence increases (t = 24 sec), which decayed again after cessation of the stimulus (t = 58 sec). Scale bars, 5 μm. B, Exemplar fluorescence transients of four boutons marked by color-coded circles in A. C, Average time course of all boutons. During stimulation with high-K+ the fluorescence intensity within boutons (n = 17) rises with a delay of a few seconds, reaches its peak shortly thereafter, and then decays within a few ten seconds. Similar signals were obtained in two other experiments. (n = 10 and n = 12 boutons; data not shown)
Figure 3.
Figure 3.
Redistribution of presynaptic clathrin during electric field stimulation. A, Fluorescence images of an EGFP-LCa1-positive axon from a hippocampal neuron under resting conditions (top), after a train of 750 APs at 20 Hz (middle) and ∼ 3 min after electric field stimulation (bottom). Boutons (white arrows) with intervening axonal regions are visible (two boutons further analyzed below are labeled B1 and B2). Scale bars, 5 μm. The images of the second round of stimulation in this axon are not shown. B, To analyze the redistribution of EGFP-LCa1 a line of interest was placed along the axon with a thickness of 3 pixels (636 nm). The fluorescence intensity along that line was plotted over time. Arrows indicate boutons marked in A, whereas arrowheads indicate fluorescence changes during stimulation. C, Exemplar fluorescence profiles from B before (green), during (red), and after stimulation (blue). Note fluorescence decreases (asterisks) in neighboring axonal regions around a bouton. D, Kinetics of fluorescence changes in two individual synaptic boutons (B1 and B2, both marked in A-C) and neighboring axonal segments normalized to the initial fluorescence intensity of the first four frames. Gray bars give time of electric field stimulation. During two trains of 750 APs, fluorescence in boutons transiently increases (red, B1: 1. stimulus: ΔF/F0 = 14.7%; 2. stimulus: ΔF/F0 = 10.8%; B2: 1. stimulus: ΔF/F0 = 25.5%; 2. stimulus ΔF/F0 = 17.7%), whereas neighboring axonal segments (green circles in B) show a temporary decrease (green). These effects are reversible and attributable to redistribution of EGFP-LCa1 between presynaptic and axonal compartments, because the fluorescence integrated over the whole axonal segments plus boutons (blue bars in B) changes very little over time (blue, B1: 1. stimulus: ΔF/F0 = -1.37%; 2. stimulus: ΔF/F0 = -2.56%; B2: 1. stimulus: ΔF/F0 = -1.69%; 2. stimulus: ΔF/F0 = -0.65%; values are corrected for slight bleaching and focus drift).
Figure 4.
Figure 4.
Overall kinetics of EGFP-LCa1 fluorescence changes during stimulation. A, Average time course of EGFP-LCa1 fluorescence responses in boutons (black) challenged by 750 APs at 20 Hz normalized to the initial fluorescence intensity (n = 40; N = 3). For comparison, the total fluorescence integrated over the whole region (axon plus bouton) is plotted in gray. B, Maximum fluorescence change in boutons (ΔF/F0 = 19.7 ± 2.42%; n = 40) and of fluorescence over whole axon ΔF/F0 = -3.2 ± 0.58% (not corrected for bleaching). C, Summary of different parameters characterizing the time courses of EGFP-LCa1 fluorescence transients for 750 APs at 20 Hz. The average delay, defined as the time between stimulus onset and rise of fluorescence five times the SD above the average signal before stimulation, was 13.7 ± 0.99 sec (n = 38). The 20-80% rise time was 17.6 ± 1.2 sec (n = 40). To characterize a plateau phase after stimulus cessation, the 100-90% decay time (τplateau) was determined, yielding values of 20.8 ± 2.7 sec (n = 40). The full width at half maximum (half width) was 65.7 ± 4.3 sec (n = 37). The falling phase is best described by the 50% decay time either measured from stimulus end (decaystim end = 47.8 ± 3.2 sec; n = 40) or from the maximum intensity (decaypeak = 38.5 ± 1.9 sec; n = 40).
Figure 6.
Figure 6.
Activity-dependent recruitment of EGFP-LCa1 to synaptic terminals is governed by fast diffusion. A, Time lapse images from a hippocampal axon with two boutons (B1 and B2) spaced at large distance before (left) and at the end (right) of electric field stimulation (750 APs, 20 Hz). Scale bars, 5.0 μm. B, For analysis the fluorescence intensity along a line of interest is plotted versus the axonal length before (green), during (red), and after stimulation (blue), as described in Figure 3C. Top panels represent B1, and bottom panels represent B2. Fluorescence transients of these two boutons (red) and at intervals of 1.3, 1.9, 2.5, and 3.2 μm left and right from the center of the boutons (blue lines of increasing saturation, also marked in B) are plotted over time. Traces are normalized to initial fluorescence (first 19 frames) and box-smoothed two times over three pixels. Note that the transient decreases are right-shifted with respect to distance from the bouton, as expected for redistribution. D, Squared distances right (blue) and left (red) from the bouton centers are plotted versus the times of fluorescence minima in the axonal regions. The linear relationship indicates that the redistribution is governed by diffusion. Linear fits gave slopes of 0.67 ± 0.56 and 0.63 ± 0.28 μm2/sec (B1) and 1.0 ± 0.37 and 2.2 ± 0.48 μm2/sec (B2), respectively, yielding diffusion constants of 0.13-0.44 μm2/sec.
Figure 7.
Figure 7.
Repeated stimulation delays EGFP-LCa1 transients. A, Average time course of EGFP-LCa1 fluorescence responses evoked with two pulses, 750 APs each at 20 Hz, spaced at 192 sec (n = 28; N = 2). B, The delay of the first stimulus (12.3 ± 1.2 sec) was significantly faster (*p = 0.0252 paired t test) than that of the second stimulus (15.4 ± 1.04 sec; n = 21). C, In contrast the rise time of the first pulse 18.7 ± 1.4 sec is slower (*p = 0.0548) than that of the second 15.9 ± 1.2 sec (n = 23). D, The plateau phases of both pulses are not significantly different (22.6 ± 2.8 and 25.5 ± 2.6 sec, respectively; n = 28; p = 0.1912). E, Similarly the full width at half maximum does not change (62.2 ± 3.6 and 65.3 ± 3.9 sec, respectively; n = 24; p = 0.3437). F, The 50% decay after stimulus end, however, slows down significantly for the second pulse (50.4 ± 3.4 and 57.3 ± 3.8 sec, respectively; n = 26; *p = 0.0138). G, When measured from the maximum amplitude, no difference can be found for the decay (40.3 ± 2.2 sec and 44.9 ± 3.5 sec, respectively; n = 26; p = 0.1413).

Similar articles

Cited by

References

    1. Aravanis AM, Pyle JL, Tsien RW (2003) Single synaptic vesicles fusing transiently and successively without loss of identity. Nature 423: 643-647. - PubMed
    1. Ashery U, Betz A, Xu T, Brose N, Rettig J (1999) An efficient method for infection of adrenal chromaffin cells using the Semliki-Forest virus gene expression system. Eur J Cell Biol 78: 525-532. - PubMed
    1. Blanpied TA, Scott DB, Ehlers MD (2002) Dynamics and regulation of clathrin coats at specialized endocytic zones of dendrites and spines. Neuron 36: 435-449. - PubMed
    1. Brodin L, Low P, Shupliakov O (2000) Sequential steps in clathrin-mediated synaptic vesicle endocytosis. Curr Opin Neurobiol 10: 312-320. - PubMed
    1. Brodsky FM, Chen CY, Knuehl C, Towler MC, Wakeham DE (2001) Biological basket weaving: formation and function of clathrin-coated vesicles. Annu Rev Cell Dev Biol 17: 517-568. - PubMed

Publication types

MeSH terms

LinkOut - more resources