. 2004 Feb 25;24(8):2054-64.
doi: 10.1523/JNEUROSCI.5066-03.2004.

The number of glutamate receptors opened by synaptic stimulation in single hippocampal spines

Affiliations

The number of glutamate receptors opened by synaptic stimulation in single hippocampal spines

Esther A Nimchinsky et al. J Neurosci. .

Abstract

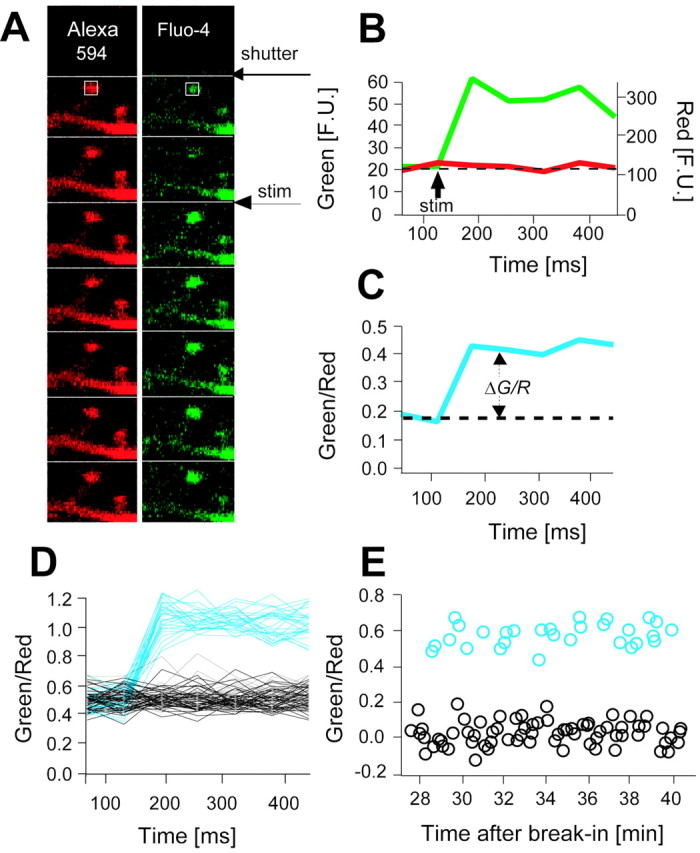
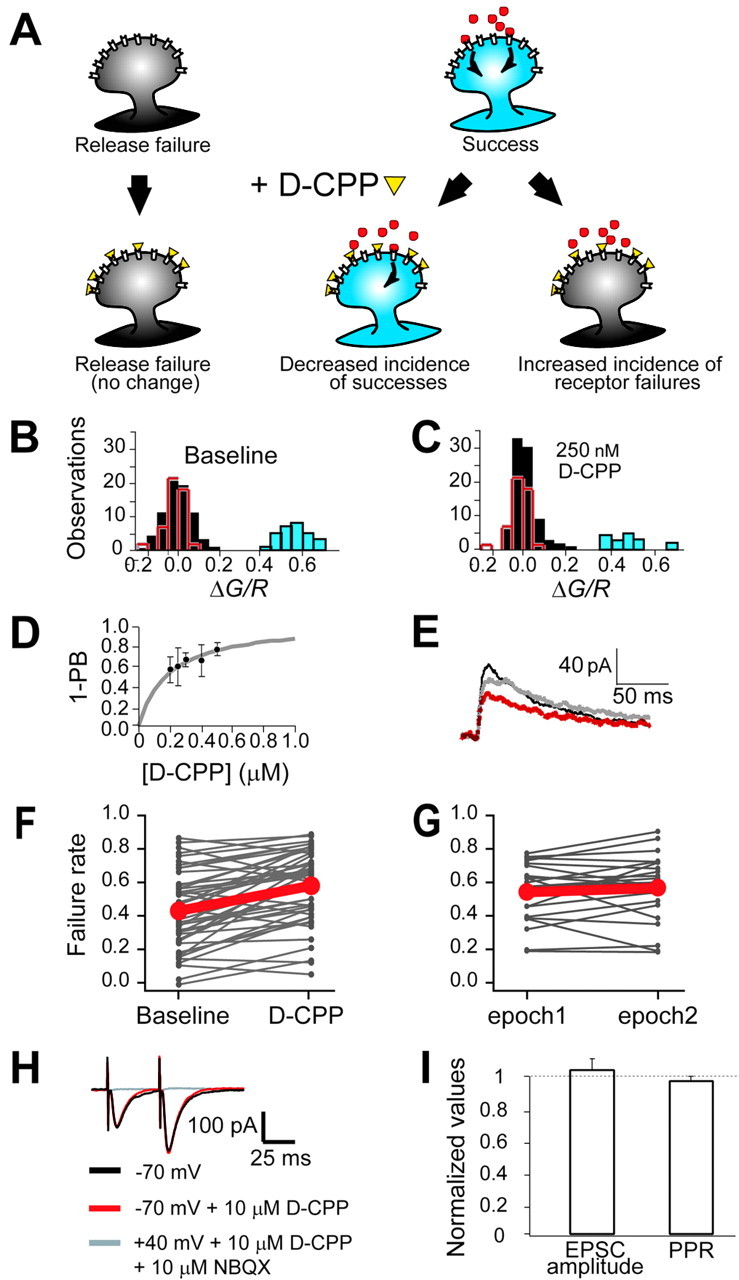
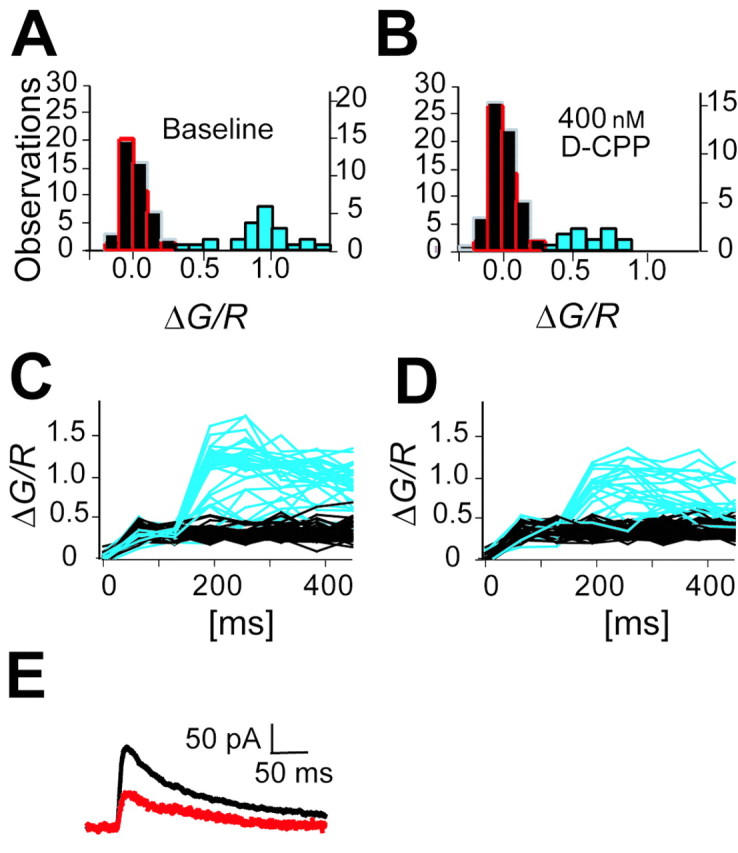
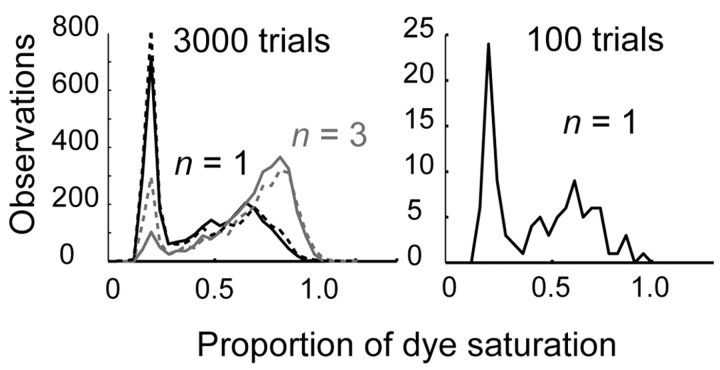
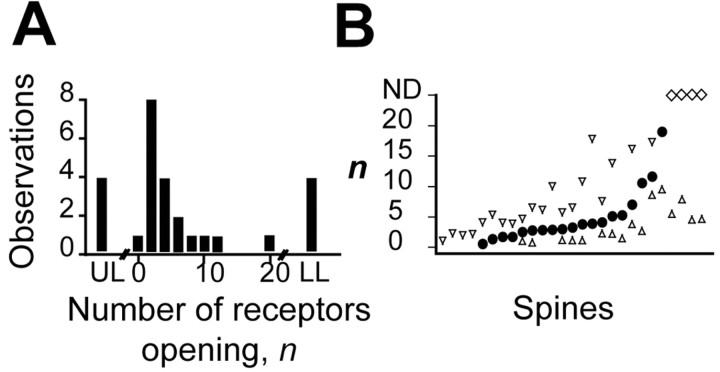
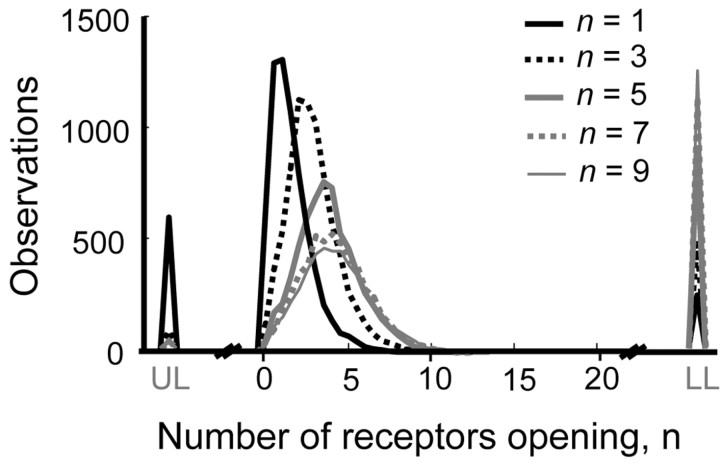
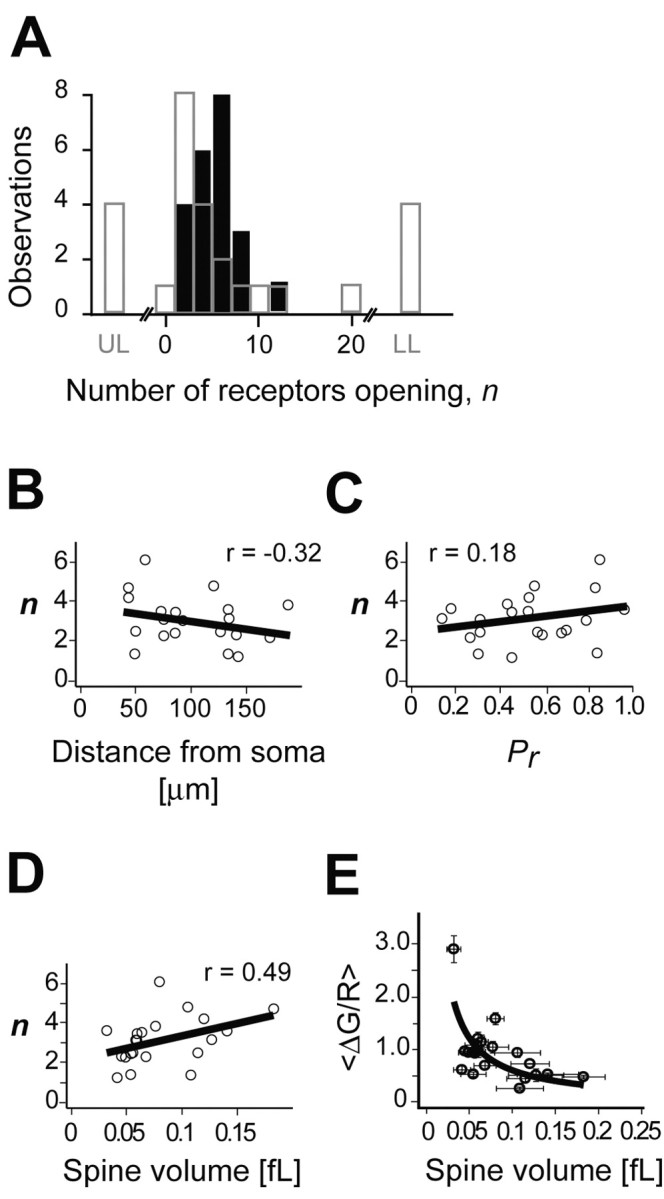
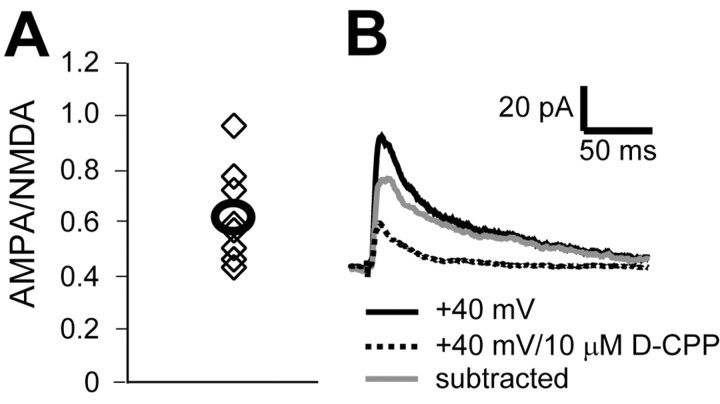
The number of receptors opening after glutamate release is critical for understanding the sources of noise and the dynamic range of synaptic transmission. We imaged [Ca2+] transients mediated by synaptically activated NMDA receptors (NMDA-Rs) in individual spines in rat brain slices. We show that Ca2+ influx through single NMDA-Rs can be reliably detected, allowing us to estimate the number of receptors opening after synaptic transmission. This number is small: at the peak of the synaptic response, less than one NMDA-R is open, on average. Therefore, stochastic interactions between transmitter and receptor contribute substantially to synaptic noise, and glutamate occupies a small fraction of receptors. The number of receptors opening did not scale with spine volume, and smaller spines experience larger [Ca2+] transients during synaptic transmission. Our measurements further demonstrate that optical recordings can be used to study single receptors in intact systems.


Figures

Figure 1.
Figure 1.
Two-photon [Ca2+] imaging of NMDA-R activation in single dendritic spines. A, A response in an individual spine imaged in frame-scan mode. A trial consists of a sequence of seven 64 msec images collected before (2 images) and after (5 images) delivery of the stimulus. The first image was collected before shutter opening to estimate the dark current. Left, Alexa 594, red; Right, Fluo-4, green (the region of interest is indicated by a white box). B, Fluorescence intensity measured in the region of interest in the green and red fluorescence channels. Note the absence of a change in fluorescence intensity in the red channel despite a dramatic change in the green channel in response to synaptic stimulation. F.U., Fluorescence units. C, Green/red ratio (blue trace) for the traces shown in B. These data are used for quantitative analysis. D, Representative set of trials from another spine, showing the clear separation between successes (blue) and failures (black). E, ΔG/R as a function of time.
Figure 2.
Figure 2.
Detection of failures of receptor activation. A, Schematic illustrating the failure analysis in single dendritic spines using the high-affinity indicator Fluo-4. Under baseline conditions (top), presynaptic stimulation results in failures, primarily because of failure of neurotransmitter release and successes attributable to binding of released glutamate to NMDA-Rs and the resultant influx of Ca2+ (arrows). Under conditions of partial NMDA-R blockade, the incidence of release failures does not change but there is an increased incidence of failures of receptors to open despite glutamate release (receptor failures), at the expense of successes. Note that under these conditions, successes are attributable to the opening of fewer channels and often a single channel. Because of dye saturation, these responses appear nearly as large as responses attributable to the opening of many channels. B, C, Frequency distributions of NMDA-R-mediated Ca2+ signals before (B) and in the presence of (C) D-CPP. Note the clear separation of successes (blue bars) from failures (black bars) in both conditions. Under conditions of partial blockade, failures increased at the expense of successes. Open histograms (red) indicate the distribution of ΔG/R in trials when no stimulus was delivered. D, Partial blockade (PB) of NMDA-R EPSCs as a function of [D-CPP]. The gray line shows the fit using the Michaelis-Menten equation. E, NMDA-R EPSCs (black line; baseline) partially blocked by 250 nm D-CPP (red line). The washout trace is indicated by the gray line. These currents are from the same experiment illustrated in A and B. F, G, D-CPP increases failure rates. F, Synapses (N = 45) that were recorded before and after the addition of D-CPP showed a mean net change of 34% (red bar). In comparison, G shows the analogous data from 15 synapses in which D-CPP was not added, to test for nonstationarity of f. When divided into epochs analogous to “baseline” and “D-CPP” epochs analyzed in the failure analysis, there was no net change in f (red bar). H, I, Absence of a presynaptic effect of D-CPP. H, Black trace, baseline at -70 mV; red trace, 10 μm D-CPP at -70 mV; gray trace, 10 μm D-CPP plus 10 μm NBQX at +40 mV, demonstrating complete blockade of the NMDA-R EPSC at this concentration of D-CPP. I, D-CPP (10 μm) does not have an effect on AMPA-R EPSC amplitude or paired-pulse ratio (PPR) (ISI, 40 msec).
Figure 6.
Figure 6.
Amplitude analysis assay to determine the number of NMDA-Rs opening at single synapses. A, B, Frequency distributions of NMDA-R-mediated calcium signals imaged using the low-affinity indicator Fluo-4FF before (A) and in the presence of (B) D-CPP. Under conditions of partial blockade, failures (black bars) increased at the expense of successes (blue bars). Open histograms (red; right axis) indicate the distribution of ΔG/R in trials when no stimulus was delivered. C, D, [Ca2+] transients corresponding to A and B. Note the wide range of response amplitudes and the overall decrease in amplitude in the presence of 400 nm D-CPP (D). E, NMDA-R-mediated EPSCs before (black) and after (red) the addition of 400 nm D-CPP.
Figure 3.
Figure 3.
Results of simulations of NMDA-R activation reported by Fluo-4 (150 μm) with 3000 (left) or 100 (right) trials. Response amplitudes are expressed as the proportion of dye saturation. Parameters are given in Table 1; Pr = 1. Two separate peaks are apparent, corresponding to successes and failures, even when only one receptor is opening, on average (n = 1; black lines). Note that when n increases from 1 to 3 (gray lines), the number of failures decreases, as expected. Dashed lines indicate simulations taking into account the variability of glutamate concentration in the cleft and of the location of glutamate release (see Materials and Methods). Note the slight increase in failures when this variability is taken into account.
Figure 4.
Figure 4.
Results from the failure analysis assay. A, Distribution of calculated values of n. Most synapses had small values of n. Synapses in which only an upper or lower limit could be computed are assigned to bins labeled UL and LL, respectively. B, Values of n ordered by magnitude. The solid circles represent the mean value of n obtained for each synapse. Only spines where at least an upper or lower limit could be computed are shown. Spines where a lower limit, but not the mean n, could be determined are indicated with diamonds. Lower (upright triangles) and upper (inverted triangles) limits, when calculable, are indicated.
Figure 5.
Figure 5.
Simulation of the failure analysis assay. To generate the distributions, Pr was varied from 0.1 and 0.9, and partial block (I′/I) from 0.4 and 0.7. The number of trials per observation was in the range 60-100, as in our experiments. Note the presence of synapses for which only upper limits (UL) or lower limits (LL) can be obtained, consistent with what was observed experimentally (compare with Fig. 4A). These cases are attributable to sampling errors in estimating f. As n increases, the failure analysis becomes relatively insensitive to the value of n, and LL cases increase.
Figure 7.
Figure 7.
Results of the amplitude analysis assay. A, Distribution of calculated values of n (solid black bars). Most synapses had small values of n, and very large values were not observed. The values obtained using the failure analysis (Fig. 4A) are replotted for comparison (gray bars). B, C, Values of n plotted against the linear distance of the synapse from the soma (B) and release probability (C). D, Values of n plotted against spine volume. E, The mean ΔG/R (<ΔG/R>) plotted against spine volume. Note the decay of <ΔG/R> with (volume)-1. Error bars represent SEM.
Figure 8.
Figure 8.
Measuring AMPA-R/NMDA-R ratios. A, AMPA-R/NMDA-R ratios in postnatal day 16-19 rats. Open triangles represent the means for each experiment, and the overall mean is indicated by the black circle. These values agree with previous reports of the same quantity (Hsia et al., 1998). B, Method for obtaining AMPA-R/NMDA-R ratios. Baseline trials (black solid trace) were taken at 40 mV above the reversal potential. Then, 10 μm D-CPP was added, and additional trials were obtained (AMPA-R component; dotted line). The trace in the presence of D-CPP was subtracted from that in its absence to obtain the NMDA-R component (gray trace). The amplitudes of the AMPA-R and NMDA-R components were computed for the AMPA-R/NMDA-R ratio, which in the present example was 0.46. The response remaining after D-CPP was eliminated by 10 μm NBQX.

Similar articles

Cited by

References

    1. Andersen P, Silfvenius H, Sundberg SH, Sveen O (1980) A comparison of distal and proximal dendritic synapses on CA1 pyramids of guinea-pig hippocampal slices in vitro. J Physiol (Lond) 307: 273-299. - PMC - PubMed
    1. Andrasfalvy BK, Magee JC (2001) Distance-dependent increase in AMPA receptor number in the dendrites of adult hippocampal CA1 pyramidal neurons. J Neurosci 21: 9151-9159. - PMC - PubMed
    1. Bading H, Ginty DD, Greenberg ME (1993) Regulation of gene expression in hippocampal neurons by distinct calcium signaling pathways. Science 260: 181-186. - PubMed
    1. Bekkers JM, Stevens CF (1989) NMDA and non-NMDA receptors are co-localized at individual excitatory synapses in cultured rat hippocampus. Nature 341: 230-233. - PubMed
    1. Casado M, Isope P, Ascher P (2002) Involvement of presynaptic N-methyl-d-aspartate receptors in cerebellar long-term depression. Neuron 33: 123-130. - PubMed

Publication types

MeSH terms