. 2004 Feb 25;32(4):e43.
doi: 10.1093/nar/gnh040.

A high-throughput method to monitor the expression of microRNA precursors

Affiliations

A high-throughput method to monitor the expression of microRNA precursors

Thomas D Schmittgen et al. Nucleic Acids Res. .

Abstract

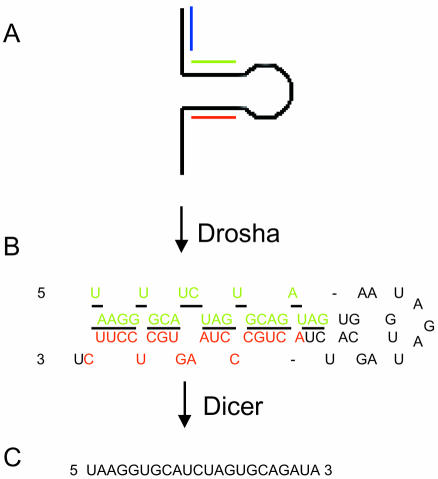
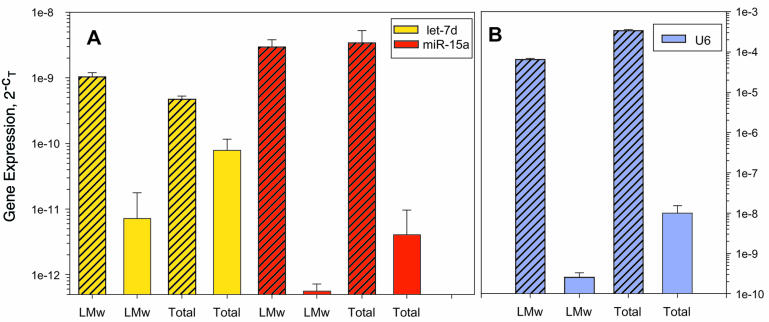
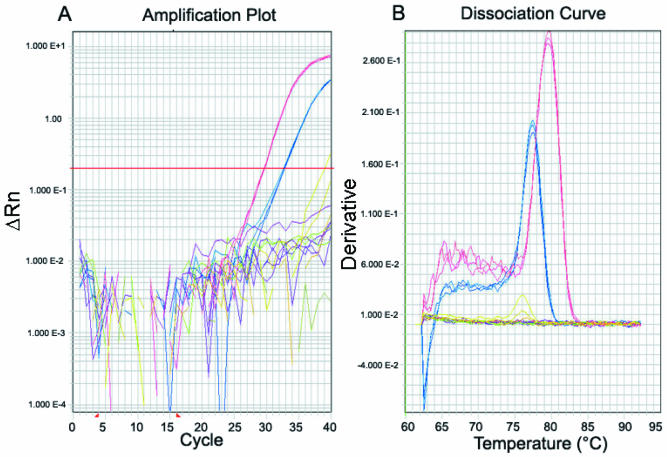
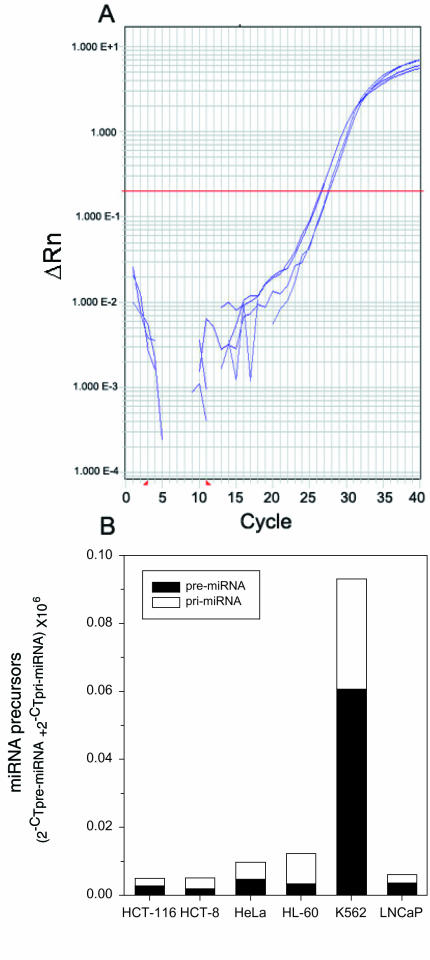
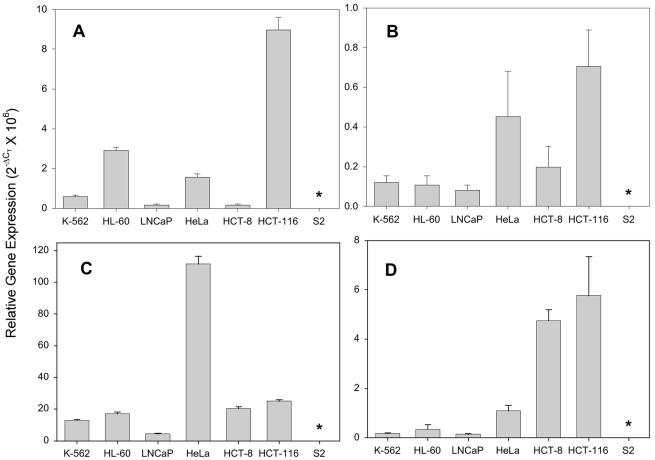
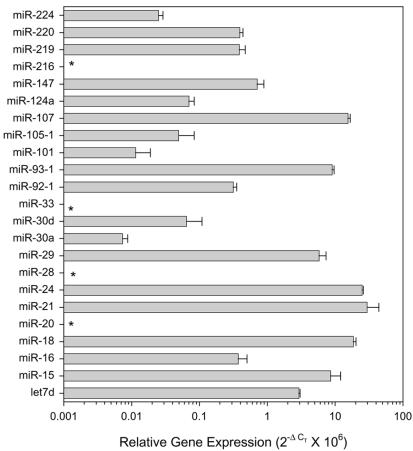
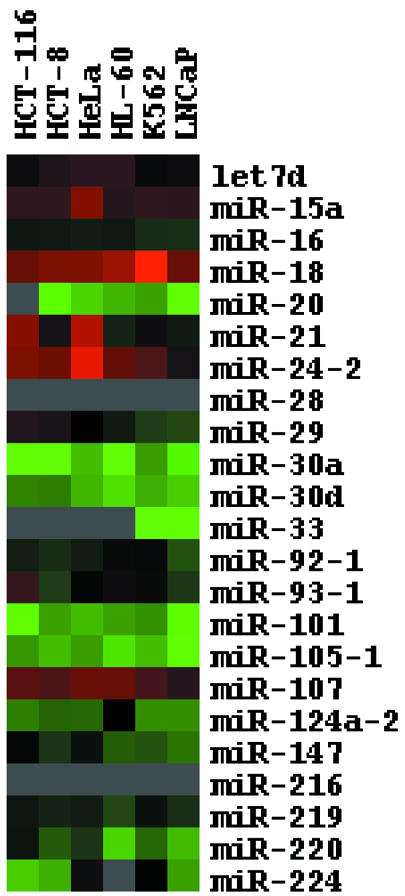
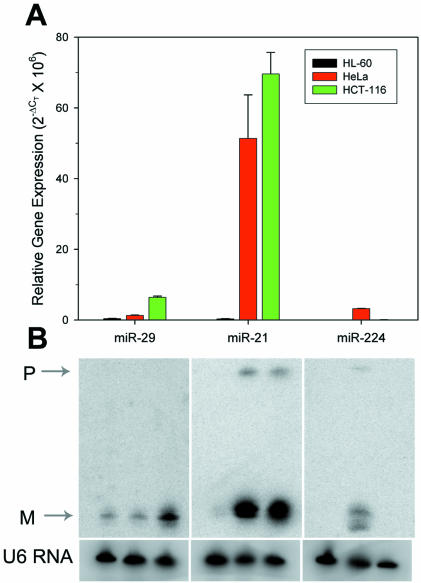
microRNAs (miRNAs) are small, functional, non-coding RNAs. miRNAs are transcribed as long primary transcripts (primary precursors) that are processed to the approximately 75 nt precursors (pre-miRNAs) by the nuclear enzyme Drosha. The approximately 22 nt mature miRNA is processed from the pre-miRNA by the RNase III Dicer. The vast majority of published studies to date have used northern blotting to detect the expression of miRNAs. We describe here a sensitive, high throughput, real-time PCR assay to monitor the expression of miRNA precursors. Gene-specific primers and reverse transcriptase were used to convert the primary precursors and pre-miRNAs to cDNA. The expression of 23 miRNA precursors in six human cancer cell lines was assayed using the PCR assay. The miRNA precursors accumulated to different levels when compared with each other or when a single precursor is compared in the various cell lines. The precursor expression profile of three miRNAs determined by the PCR assay was identical to the mature miRNA expression profile determined by northern blotting. We propose that the PCR assay may be scaled up to include all of the 150+ known human miRNA genes and can easily be adaptable to other organisms such as plants, Caenorhabditis elegans and Drosophila.


Figures

Figure 1
Figure 1
miRNA processing and primer design. miRNAs such as human miR-18 are transcribed as (A) a large primary precursor (pri-miRNA) that is processed by the nuclear enzyme Drosha to produce (B) the putative 62 nt precursor miRNA (pre-miRNA). Both the pri-miRNA and pre-miRNA contain the hairpin structure. The underlined portion of the pre-miRNA represents the sequence of (C) the 22 nt mature miRNA that is processed from the pre-miRNA by the RNase Dicer. Green, hybridization sequence of the forward primer; red, hybridization sequence of the reverse primer; blue, sense primer used along with the reverse (red) primer to amplify the pri-miRNA only.
Figure 2
Figure 2
Amplification of short hairpins by the PCR. HeLa cell genomic DNA was amplified by the PCR using primers for miR-124a-2 (lane 1), miR-93-1 (lane 2), let7-d (lane 3), miR-15a (lane 4), miR-16 (lane 5) and miR-147 (lane 6) and resolved on a 2.2% agarose gel. M, 25 bp DNA ladder.
Figure 3
Figure 3
Optimal reverse transcription conditions for small RNAs. Total RNA was isolated from HCT-116 cells, a fraction of which was further purified to contain a low molecular weight (LMW) fraction of <160 nt. A 1 µg aliquot of total or LMW RNA was converted to cDNA using Thermoscript reverse transcriptase and random hexamers (open bars) or gene-specific primers (striped bars). The resulting cDNA was amplified by real-time PCR using primers for (A) let7d, miR-15a or (B) U6 RNA. Mean ± SD, triplicate PCRs from a single cDNA.
Figure 4
Figure 4
Real-time PCR of miRNA precursors. Gene-specific primers were designed to the hairpin of the miR-21 and let-7d miRNA precursors. The cDNA from human cancer cell lines was amplified by real-time PCR and SYBR green detection. (A) Real-time PCR plots of HCT-8 cDNA using miR-21 primers (blue plot, CT = 32.8) and let-7d primers (red plot, CT = 29.7). Also shown are the signals that were generated from the no template control reactions (olive plots) and the no reverse transcription control reactions (purple plots). (B) Dissociation curve generated from the heat dissociation protocol that followed the real-time PCR shown in (A) The presence of one peak on the thermal dissociation plot corresponds to a single amplicon from the PCR. The plot colors in (B) match those described in (A).
Figure 5
Figure 5
Pri-miRNA and pre-miRNA expression in human cancer cell lines. (A) Total RNA from HeLa cells was converted to cDNA using gene-specific primers as described in Materials and Methods. The cDNA was amplified by real-time PCR using primers that anneal to the hairpin present in both the pri-miR-18 and pre-miR-18 (CT = 26.6) or to the pri-miRNA only (CT = 27.6). (B) Total miR-18 precursor expression (pri-miRNA + pre-miRNA) and individual expression (pri-miRNA or pre-miRNA) in six cancer cell lines. Mean of duplicate real-time PCRs from a single cDNA sample.
Figure 6
Figure 6
miRNA precursor expression in human cancer cell lines. The expression of the miRNA precursors for miR-93-1 (A), miR-147 (B), miR-24-2 (C) and miR-29 (D) in six human tumor cell lines and Drosophila S2 cells was determined by real-time PCR. Gene expression is presented relative to U6 RNA. Mean ± SD of triplicate real-time PCRs from a single cDNA sample. *Undectectable expression.
Figure 7
Figure 7
miRNA precursor expression in the human colorectal cancer cell line HCT-116. The expression of 23 miRNA precursors was determined in the human colorectal cancer cell line HCT-116 by real-time PCR. Gene expression is presented relative to U6 RNA. Mean ± SD of triplicate real-time PCRs from a single cDNA sample. *Undetectable expression.
Figure 8
Figure 8
Treeview analysis of real-time PCR data. The expression of 23 miRNA precursors and U6 RNA was determined in six human cancer cell lines by real-time PCR. The relative expression of each gene (mean of triplicate real-time PCRs from a single cDNA sample) was determined as described in Materials and Methods. A median expression value equal to 1 was designated black. Red shading indicates increased levels of expression, and green shading represents decreased levels of expression relative to the median. Gray color denotes undectectable expression. Data are presented on a logarithmic scale.
Figure 9
Figure 9
Validation of real-time PCR data by northern blotting. (A) The precursor expression for miR-29, -21 and -224 relative to U6 RNA was determined by real-time PCR in HL-60, HeLa and HCT-116 cDNA (mean ± SD triplicate RNA isolations/reverse transcriptions). (B) Northern blot of the ∼22 nt mature miRNA and the ∼75 nt pre-miRNA in the same cell lines shown in (A) The blots were stripped and re-probed for U6 RNA. P, pre-miRNA, M, mature miRNA.

Similar articles

Cited by

References

    1. Pasquinelli A.E. and Ruvkun,G. (2002) Control of developmental timing by microRNAs and their targets. Annu. Rev. Cell. Dev. Biol., 18, 495–513. - PubMed
    1. Moss E.G. and Poethig,R.S. (2002) MicroRNAs: something new under the sun. Curr. Biol., 12, R688–R690. - PubMed
    1. Grishok A., Pasquinelli,A.E., Conte,D., Li,N., Parrish,S., Ha,I., Baillie,D.L., Fire,A., Ruvkun,G. and Mello,C.C. (2001) Genes and mechanisms related to RNA interference regulate expression of the small temporal RNAs that control C.elegans developmental timing. Cell, 106, 23–34. - PubMed
    1. Hutvagner G., McLachlan,J., Pasquinelli,A.E., Balint,E., Tuschl,T. and Zamore,P.D. (2001) A cellular function for the RNA-interference enzyme Dicer in the maturation of the let-7 small temporal RNA. Science, 293, 834–838. - PubMed
    1. Ketting R.F., Fischer,S.E., Bernstein,E., Sijen,T., Hannon,G.J. and Plasterk,R.H. (2001) Dicer functions in RNA interference and in synthesis of small RNA involved in developmental timing in C.elegans.Genes Dev., 15, 2654–2659. - PMC - PubMed