. 2004 Mar 9;101(10):3444-9.
doi: 10.1073/pnas.0307691101. Epub 2004 Feb 25.

Kinesin's second step

Affiliations

Kinesin's second step

Lisa M Klumpp et al. Proc Natl Acad Sci U S A. .

Abstract

We have identified dimeric kinesin mutants that become stalled on the microtubule after one ATP turnover, unable to bind and hydrolyze ATP at their second site. We have used these mutants to determine the regulatory signal that allows ATP to bind to the forward head, such that processive movement can continue. The results show that phosphate release occurs from the rearward head before detachment, and detachment triggers active-site accessibility for ATP binding at the forward head. This mechanism, in which the rearward head controls the behavior of the forward head, may be conserved among processive motors.


Figures
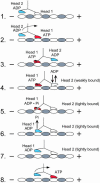
Fig. 1.
Fig. 1.
Walking model defining kinesin's second step. Head 1 binds the Mt with rapid ADP release. ATP binding at head 1 leads to the plus-end-directed motion of the neck linker to position head 2 forward at the next Mt-binding site. ATP binding at head 1 promotes head 2 binding to the Mt, followed by rapid ADP release. ATP hydrolysis at head 1 locks head 2 onto the Mt in a tight-binding state. Phosphate release occurs on head 1, followed by detachment from the Mt. The active site of head 2 is then accessible for ATP binding, and the cycle is repeated.
Fig. 2.
Fig. 2.
Pre-steady-state kinetics of E164A and E164K. (A and B) The Mt·E164A complex plus MDCC-PBP was mixed with various concentrations of MgATP plus potassium chloride. Final concentrations are as follows: 0.5 μM E164A, 1 μM tubulin, 10 μM taxol, 5 μM MDCC-PBP, 0.05 units/ml PNPase, 0.15 mM MEG, MgATP, and 100 mM potassium chloride (in addition to 50 mM potassium acetate in the buffer). A Inset shows a representative transient of the Mt·E164A complex at 300 μM MgATP (kobs = 37.2 ± 0.2 s-1, relative amplitude = 0.138 ± 0.0008 V). The rate of the exponential fluorescence enhancement increases as a function of MgATP. The fit of the data to a hyperbola provides the maximum-rate constant for phosphate release for E164A at 150 mM salt, kobs = 39.1 ± 1.6 s-1; K1/2,ATP = 16.6 ± 3.2 μM. (B) Amplitudes of each of the phosphate transients in units of concentration were plotted as a function of ATP concentration. The fit of the data to a hyperbola provided the maximum amplitude 0.275 ± 0.0045 μM Pi, which corresponds to 55.0 ± 0.9% of the 0.5 μM E164A sites. Inset shows the calibration curve used to convert the burst amplitude in volts to sites binding Pi. (C and D) Phosphate-release kinetics for E164K. Conditions are as described for A. C Inset shows the phosphate-release kinetics for the Mt·E164K complex at 300 μM MgATP (kobs = 25.8 ± 0.2 s-1, relative amplitude = 0.131 ± 0.0009 V). The observed rate of the initial exponential fluorescence enhancement of each transient was plotted as a function of MgATP concentration. The maximum-rate constant for phosphate release for E164K at 150 mM salt, kobs = 26.0 ± 0.57 s-1; K1/2,ATP = 13.1 ± 1.4 μM. (D) Amplitude in volts of each E164K phosphate transient was converted to units of concentration by using the calibration curve shown in Inset. The maximum amplitude at 0.32 ± 0.0029 μM Pi corresponds to 64.0 ± 0.6% of the 0.5 μM E164K sites. (E) ATP-promoted dissociation of the Mt·kinesin complex. The preformed Mt·motor complex was mixed with 2 mM MgATP in ATPase buffer with 50 mM potassium acetate plus additional potassium chloride. Final concentrations are as follows: 3 μM motor, 2.9 μM tubulin, 20 μM taxol, 1 mM MgATP, and various concentrations of salt. (FH) MantATP-binding kinetics. (F) A preformed Mt·E164K complex was rapidly mixed in the stopped-flow instrument with varying concentrations of mantATP in ATPase buffer containing (final concentrations) 3 μM motor, 10 μM tubulin, 20 μM taxol, varying concentrations of mantATP, and 50 mM potassium acetate from buffer. Representative transients, shown from the top to the bottom transient, are 40, 25, and 6 μM mantATP, with the fit of the data to a single exponential function, shown by the smooth line. The rate of the exponential fluorescence enhancement was plotted as a function of mantATP concentration, and the slope provides the second-order rate constant kon = 1.26 ± 0.03 μM-1s-1. (G) MantATP-binding kinetics at 20 μM mantATP to compare relative amplitudes. Final concentrations are as follows: 5 μM motor, 15 μM tubulin, 20 μM taxol, and 20 μM mantATP. The final salt concentration includes the contribution of 50 mM potassium acetate present in the buffer. (H) MantATP-binding kinetics at 100 μM mantATP to compare the relative amplitudes of dimeric E164A and E164K with monomeric kinesin, wild-type K341. Final concentrations are as follows: 5 μM motor, 15 μM tubulin, 20 μM taxol, 100 μM mantATP, and 50 or 250 mM salt.
Fig. 3.
Fig. 3.
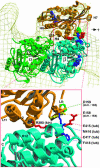
Potential interactions of Drosophila E164 (rat E158) at the β-sheet 5a–loop 8b junction with Mt amino acids were determined by docking the monomeric rat kinesin 2KIN (33) into the cryo-EM 3D scaffold of a Mt·kinesin complex by using the atomic coordinates of α,β-tubulin (34) and the software package o (35). The kinesin motor domain is shown in yellow, and the amino acid residues are designated by the rat sequence (rat E158, D159; D. melanogaster E164, D165; and human E157, D158). The β-tubulin subunit (cyan) is shown nucleotide-bound (blue) and taxol-bound (cyan), and the Mt plus-end is shown to the right. The nucleotide-bound α-tubulin subunit is shown in green. Kinesin and the Mt interact predominantly through the C-terminal tubulin helices 12 and 11 (cyan). Note the close proximity of kinesin E158 to kinesin residue R280 on α-helix 5 and to β-tubulin residues E415, E417, M416, and F418 on α-helix 12. The key kinesin structural elements for Mt binding are the switch II cluster α4-L12-α5, loops L11 and L8, and β5a,b. Kinesin α-helices 4, 5, 6, and 7 are designated H4, H5, H6, and H7, respectively.

References

    1. Vale, R. D. & Milligan, R. A. (2000) Science 288, 88-95. - PubMed
    1. Schief, W. R. & Howard, J. (2001) Curr. Opin. Cell Biol. 13, 19-28. - PubMed
    1. Schliwa, M. & Woehlke, G. (2003) Nature 422, 759-765. - PubMed
    1. Gilbert, S. P., Webb, M. R., Brune, M. & Johnson, K. A. (1995) Nature 373, 671-676. - PMC - PubMed
    1. Gilbert, S. P., Moyer, M. L. & Johnson, K. A. (1998) Biochemistry 37, 792-799. - PubMed

Publication types

MeSH terms

LinkOut - more resources