. 2004 Mar 9;101(10):3621-6.
doi: 10.1073/pnas.0308753101. Epub 2004 Feb 26.

Overexpression of acid-sensing ion channel 1a in transgenic mice increases acquired fear-related behavior

Affiliations

Overexpression of acid-sensing ion channel 1a in transgenic mice increases acquired fear-related behavior

John A Wemmie et al. Proc Natl Acad Sci U S A. .

Abstract

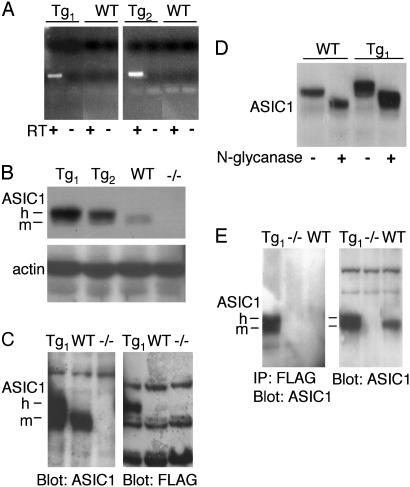
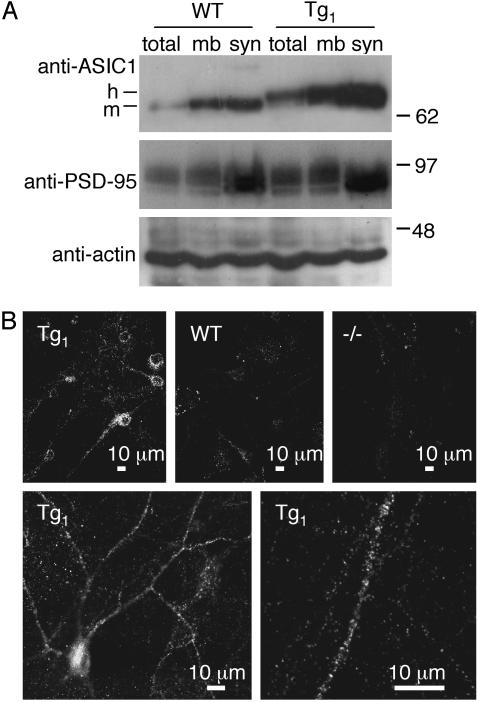
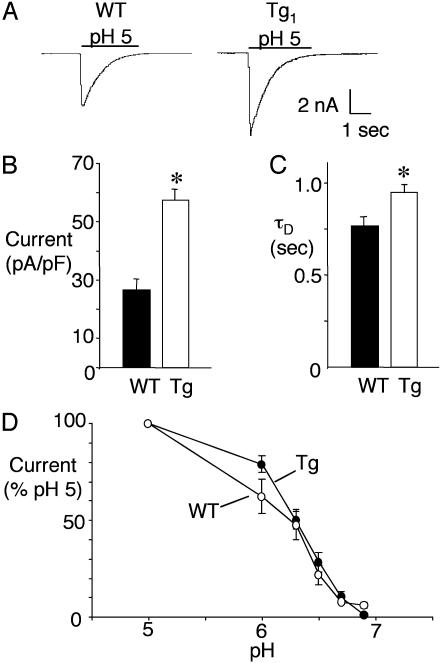
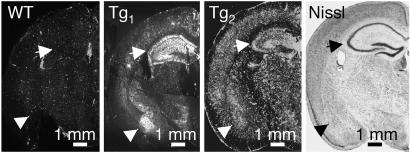
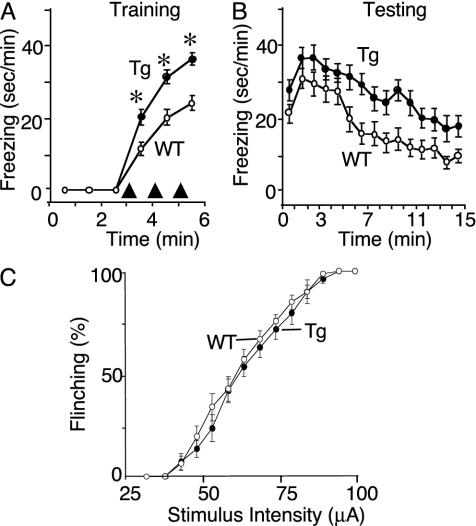
The acid-sensing ion channel 1a (ASIC1a) is abundantly expressed in the amygdala complex and other brain regions associated with fear. Studies of mice with a disrupted ASIC1 gene suggested that ASIC1a may contribute to learned fear. To test this hypothesis, we generated mice overexpressing human ASIC1a by using the pan-neuronal synapsin 1 promoter. Transgenic ASIC1a interacted with endogenous mouse ASIC1a and was distributed to the synaptosomal fraction of brain. Transgenic expression of ASIC1a also doubled neuronal acid-evoked cation currents. The amygdala showed prominent expression, and overexpressing ASIC1a enhanced fear conditioning, an animal model of acquired anxiety. These data raise the possibility that ASIC1a and H(+)-gated currents may contribute to the development of abnormal fear and to anxiety disorders in humans.


Figures

Fig. 1.
Fig. 1.
FLAG-hASIC1 expression in Tg mouse brain. (A) RT-PCR analysis of transgene expression in total brain RNA from Tg1, Tg2, and WT mice. Experiments were performed with (+) or without (-) reverse transcriptase (RT). (B) Western blot analysis of ASIC1 expression in whole brain protein lysates from mice of indicated genotype. Blot was probed with antibody (MTY) directed against an epitope common to the C-termini of both mouse and human ASIC1. Actin immunoblotting was used to confirm equivalent protein loading. -/-, ASIC1 null animals. h and m, human and mouse ASIC1a, respectively. (C) Whole brain lysates were blotted with anti-ASIC1 antibody (MTY) or anti-FLAG antibody. Both blots were obtained from the same gel. Compared to Western blot in B, the electrophoresis time was extended for better resolution of the two ASIC1a species. (D) Whole brain lysates were treated with (+) or without (-) N-glycanase and blotted with MTY. (E) Whole brain lysates were immunoprecipitated with anti-FLAG antibody followed by immunoblotting with MTY (Left) or blotted with MTY without immunoprecipitation (Right).
Fig. 2.
Fig. 2.
Subcellular distribution of ASIC1 in WT and Tg mice. (A) Whole brain lysates (total), membranes (mb), and the synaptosome-containing brain fraction (syn) were western blotted with the indicated antibodies. (B) Cultured hippocampal neurons were prepared from mice with indicated genotypes and immunolabeled with affinity-purified anti-ASIC MTY antibody. (Lower) Immunolabeling of Tg1 neurons at higher magnification. The bed of glial cells underlying the neurons showed no immunofluorescence.
Fig. 3.
Fig. 3.
Proton-gated currents in cultured hippocampal neurons from WT and Tg mice. (A) Representative traces from mice of indicated genotype. (B) Peak current density during pH 5 application (n = 52 for Tg; n = 33 for WT). *, P ≤ 0.001 compared to WT by Student's t test. (C) Desensitization rate (τD) of currents evoked by pH 5 solution (n = 41 for Tg; n = 22 for WT). *, P ≤ 0.05 compared to WT. (D) pH dose-response curve. Error bars represent SEM.
Fig. 4.
Fig. 4.
Immunohistochemistry of coronal sections of forebrain from WT, Tg1, and Tg2 mice. Labeling with the anti-FLAG antibody is in white. The arrows point to hippocampal formation, and the arrowheads point to the amygdala complex. A Nissl-stained section from a WT mouse is included for orientation.
Fig. 5.
Fig. 5.
Behavioral analysis of context fear conditioning. (A) Amount of time mice froze during 1-min intervals (sec/min) during training. The delivery of foot-shocks is indicated by arrowheads. Data from Tg1 (n = 13) and Tg2 (n = 11) mice were not statistically different (P = 0.98), and so were pooled. Data are mean ± SEM. *, P < 0.0001 compared to WT (n = 25 for WT; n = 24 for Tg). (B) Amount of time mice froze during 1-min intervals (sec/min) during testing. Tg mice spent more time freezing than WT animals (P < 0.0001 by linear mixed model analysis for repeated measures). (C) Percentage of foot-shocks that evoked a flinching response determined over a range of stimulus intensities. At each intensity, 10 foot-shocks were delivered (n = 15 for WT; n = 17 for Tg). P = 0.49 by logistic regression with the procedure genmod (sas/stat v.8.1, SAS Institute, Cary, NC).

References

    1. Lecrubier, Y. (2001) J. Clin. Psychiatry 62, 4-9. - PubMed
    1. Gorman, J. M., Kent, J. M., Sullivan, G. M. & Coplan, J. D. (2000) Am. J. Psychiatry 157, 493-505. - PubMed
    1. Kim, J. J., Rison, R. A. & Fanselow, M. S. (1993) Behav. Neurosci. 107, 1093-1098. - PubMed
    1. LeDoux, J. E. (2000) Annu. Rev. Neurosci. 23, 155-184. - PubMed
    1. Maren, S. (2001) Annu. Rev. Neurosci. 24, 897-931. - PubMed

Publication types

MeSH terms

LinkOut - more resources