Comparative Study
. 2004 Mar;86(3):1753-62.
doi: 10.1016/S0006-3495(04)74243-5.

Elasticity and adhesion force mapping reveals real-time clustering of growth factor receptors and associated changes in local cellular rheological properties

Affiliations
Comparative Study

Elasticity and adhesion force mapping reveals real-time clustering of growth factor receptors and associated changes in local cellular rheological properties

N Almqvist et al. Biophys J. 2004 Mar.

Abstract

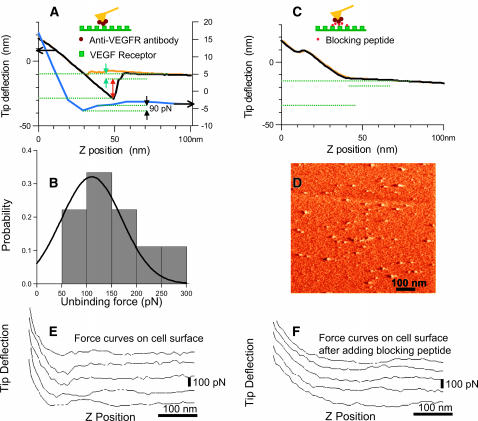
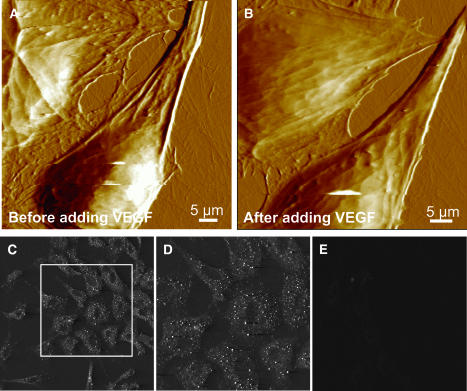
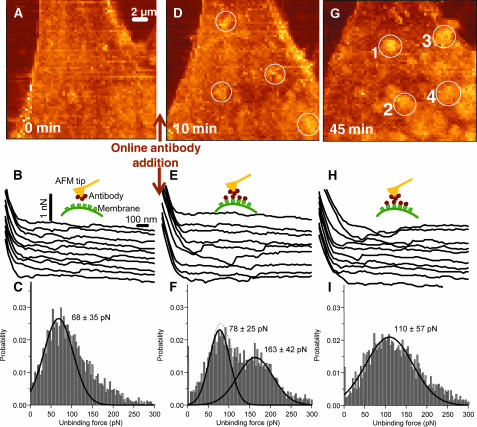
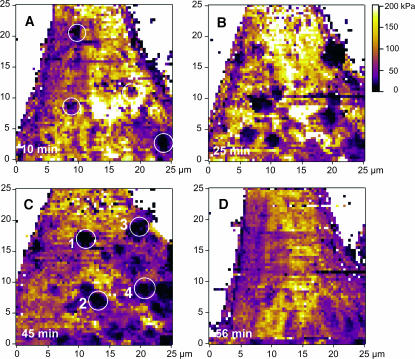
Cell surface macromolecules such as receptors and ion channels serve as the interface link between the cytoplasm and the extracellular region. Their density, distribution, and clustering are key spatial features influencing effective and proper physical and biochemical cellular responses to many regulatory signals. In this study, the effect of plasma-membrane receptor clustering on local cell mechanics was obtained from maps of interaction forces between antibody-conjugated atomic force microscope tips and a specific receptor, a vascular endothelial growth factor (VEGF) receptor. The technique allows simultaneous measurement of the real-time motion of specific macromolecules and their effect on local rheological properties like elasticity. The clustering was stimulated by online additions of VEGF, or antibody against VEGF receptors. VEGF receptors are found to concentrate toward the cell boundaries and cluster rapidly after the online additions commence. Elasticity of regions under the clusters is found to change remarkably, with order-of-magnitude stiffness reductions and fluidity increases. The local stiffness reductions are nearly proportional to receptor density and, being concentrated near the cell edges, provide a mechanism for cell growth and angiogenesis.


Figures

FIGURE 1
FIGURE 1
Adhesion (unbinding/binding) forces between VEGF receptor and its antibody. (A) Adhesion force between isolated VEGF receptor (flk-1) adsorbed on the mica substrate and AFM tip conjugated with an antibody (anti-flk-1). The top AFM force curves with deflection scale to the left show the approach (yellow) and retract (black) curve, respectively. The retract curve reveals large multiple de-adhesion steps (arrows) and specific interaction between the antibody (anti-Flk-1) on the tip and the receptors on mica surface. The last unbinding step (green arrow) is attributed to unbinding of a single receptor-antibody pair. The lower blue curve (with deflection scale to the right) shows a more typical interaction. The expected single pair unbinding is ∼100 pN and might correspond to single/double binding. (B) Probability histogram of manually measured unbinding forces from force curves measured as in A. (C) Control; competitive inhibition. The force curve in A between the antibody on the tip and the receptors on mica surface is abolished by online addition of the blocking peptide against which the antibody was made. (D) AFM tapping mode amplitude image of the VEGF receptors sparsely distributed on a silanized mica surface. (E) Adhesion force between VEGF receptor (flk-1) on endothelial cell and AFM tip conjugated with an antibody (anti-flk-1). (F) Force curves on the cell after adding the blocking peptide. The force curves in E indicates larger adhesion force versus no adhesion force in the presence of the blocking peptide (F).
FIGURE 2
FIGURE 2
AFM images of endothelial cells showing VEGF induced cytoskeletal reorganization, (A) before adding VEGF and (B) 2 h after adding VEGF (25 nM). Cytoskeletal reorganization as well as a change in the elasticity is observed. Cell softness is reflected in a loss of fine ultrastructural details. (C–D) Immunofluorescence labeling of Flk-1 receptors in the plasma membrane. Endothelial cells show immunolabeling with a polyclonal anti-Flk-1 antibody followed by cy-3 conjugated secondary antibody. D shows a zoomed image of a portion of C. Receptors are distributed throughout the cell surface with a higher density along the cell periphery. (E) Endothelial cells show no immunolabeling with a nonspecific antibody followed by cy-3 conjugated secondary antibody.
FIGURE 3
FIGURE 3
Force maps on endothelial cells in real-time. (A–C) Specific interaction probed with a Si3N4 tip functionalized with anti-Flk-1. (A) Force map. (B) Force curves taken at various points on the cell from the map shown in A. The curves are offset with respect to zero force. (C) Probability histogram of the unbinding forces of the force curves from the force map in A. The histogram is fitted with a Gaussian and the corresponding maxima and σ is indicated in the figure. The dominant unbinding force ∼60–70 pN suggests breakage of single receptor-antibody bonds. (D–F) Competitive inhibition probed with the anti-Flk-1 functionalized Si3N4 tip, 10 min after adding antibody in the recording medium. The panels correspond to A–C. The characteristic unbinding force is suppressed and the measured forces are shifted toward higher values. (G–I) Corresponds to A–C, but at 45 min after adding antibody in the recording medium. The micrometer-sized brighter spots in G are identified as receptor clusters. A few of the clusters are marked by numbers 1–4.
FIGURE 4
FIGURE 4
Elasticity maps of the evaluated Young's modulus on endothelial cells in real-time, showing clustering of VEGF receptors on the cell surface. The images are color-coded according to the color bar, from 0 kPa (dark) to 200 kPa (bright yellow). The images show the elasticity at different time points after adding anti-flk-1 antibody in the imaging solution: (A) 10 min after addition; (B) 25 min after addition; (C) 45 min after addition; and (D) 56 min after addition. A few regions with lower elasticity are marked with numbers 1–4 in C. These are the same regions showing receptor clusters in Fig. 3 G (marked as 1–4). The regions underlying the receptor clusters appeared as less stiff.

Similar articles

Cited by

References

    1. Aileen, C., and T. M. Moy. 2000. Cross-linking of cell surface receptors enhances cooperativity of molecular adhesion. Biophys. J. 78:2814–2820. - PMC - PubMed
    1. Almqvist, N., Y. del Amo, B. L. Smith, N. H. Thomson, Å. Bartholdson, M. Brzenski, R. Lal, and P. K. Hansma. 2001. Micromechanical and structural properties of a pennate diatom investigated by atomic force microscopy. J. Microsc. 202:518–532. - PubMed
    1. Antonova, I., O. Arancio, A. C. Trillat, H.-G. Wang, L. Zablow, H. Udo, E. R. Kandel, and R. D. Hawkins. 2001. Rapid increase in clusters of presynaptic proteins at onset of long-lasting potentiation. Science. 294:1547–1550. - PubMed
    1. Baumgartner, W., P. Hinterdorfer, W. Ness, A. Raab, D. Vestweben, H. Schindler, and D. Drenckhahn. 2000. Cadherin interaction probed by atomic force microscopy. Proc. Natl. Acad. Sci. USA. 97:4005–4010. - PMC - PubMed
    1. Benoit, M., D. Gabriel, G. Gerish, and H. E. Gaub. 2000. Discrete interactions in cell adhesion measured by single-molecule force spectroscopy. Nat. Cell Biol. 2:313–317. - PubMed

Publication types

MeSH terms

Substances

LinkOut - more resources