

Electric field-driven transformations of a supported model biological membrane--an electrochemical and neutron reflectivity study
- PMID: 14990503
- PMCID: PMC1304011
- DOI: 10.1016/S0006-3495(04)74244-7
Electric field-driven transformations of a supported model biological membrane--an electrochemical and neutron reflectivity study
Abstract
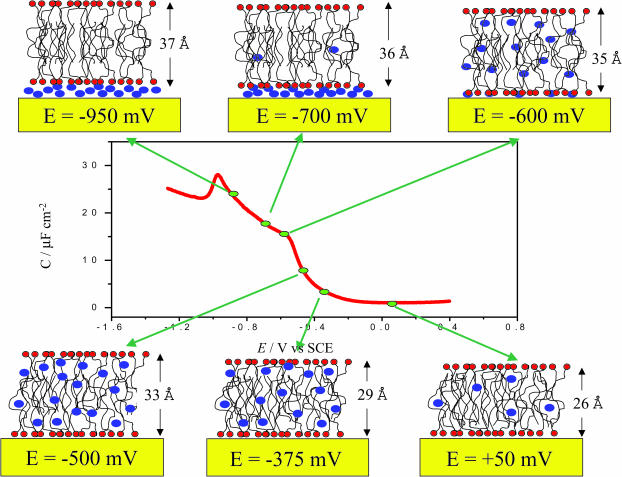
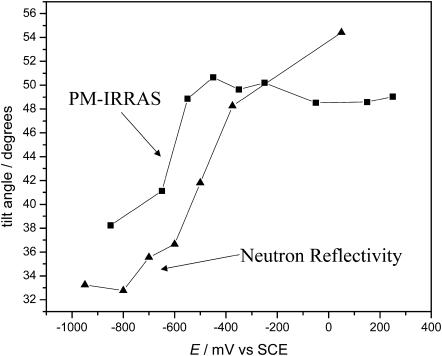
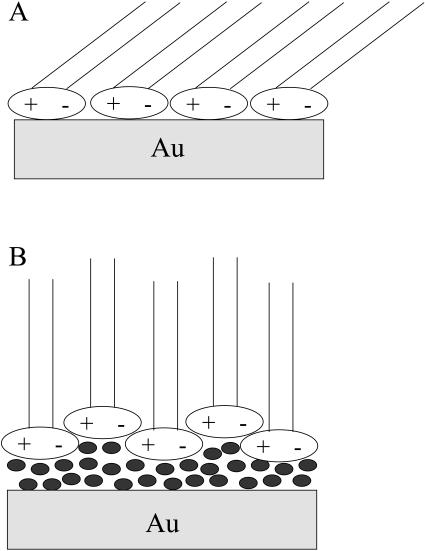
A mixed bilayer of cholesterol and dimyristoylphosphatidylcholine has been formed on a gold-coated block of quartz by fusion of small unilamellar vesicles. The formation of this bilayer lipid membrane on a conductive surface allowed us to study the influence of the support's surface charge on the structure and hydration of the bilayer lipid membrane. We have employed electrochemical measurements and the specular reflection of neutrons to measure the thickness and water content in the bilayer lipid membrane as a function of the charge on the support's surface. When the surface charge density is close to zero, the lipid vesicles fuse directly on the surface to form a bilayer with a small number of defects and hence small water content. When the support's surface is negatively charged the film swells and incorporates water. When the charge density is more negative than -8 micro C cm(-2), the bilayer starts to detach from the metal surface. However, it remains in a close proximity to the metal electrode, being suspended on a thin cushion of the electrolyte. The field-driven transformations of the bilayer lead to significant changes in the film thicknesses. At charge densities more negative than -20 micro C cm(-2), the bilayer is approximately 37 A thick and this number is comparable to the thickness determined for hydrated multilayers of dimyristoylphosphatidylcholine from x-ray diffraction experiments. The thickness of the bilayer decreases at smaller charge densities to become equal to approximately 26 A at zero charge. This result indicates that the tilt of the acyl chains with respect to the bilayer normal changes from approximately 35 degrees to 59 degrees by moving from high negative charges (and potentials) to zero charge on the metal.
Figures
Similar articles
-
Influence of the electric field on a bio-mimetic film supported on a gold electrode.Colloids Surf B Biointerfaces. 2005 Feb 25;40(3-4):117-22. doi: 10.1016/j.colsurfb.2004.10.029. Colloids Surf B Biointerfaces. 2005. PMID: 15708498
-
Spectroelectrochemical studies of bilayers of phospholipids in gel and liquid state on Au(111) electrode surface.Bioelectrochemistry. 2004 Jun;63(1-2):137-47. doi: 10.1016/j.bioelechem.2003.12.004. Bioelectrochemistry. 2004. PMID: 15110264
-
Electric field unbinding of solid-supported lipid multilayers.Eur Phys J E Soft Matter. 2005 Nov;18(3):273-8. doi: 10.1140/epje/e2005-00028-7. Epub 2005 Oct 18. Eur Phys J E Soft Matter. 2005. PMID: 16231077
-
Liposomes form nanotubules and long range networks in the presence of electric field.J Nanosci Nanotechnol. 2007 Jul;7(7):2283-6. doi: 10.1166/jnn.2007.646. J Nanosci Nanotechnol. 2007. PMID: 17663241 Review.
-
Recent Advances in Light Energy Conversion with Biomimetic Vesicle Membranes.Chembiochem. 2021 Nov 16;22(22):3140-3147. doi: 10.1002/cbic.202100220. Epub 2021 Jul 14. Chembiochem. 2021. PMID: 34223700 Free PMC article. Review.
Cited by
-
Effect of an electric field on a floating lipid bilayer: A neutron reflectivity study.Eur Phys J E Soft Matter. 2006 Oct;21(2):153-9. doi: 10.1140/epje/i2006-10054-8. Epub 2006 Dec 6. Eur Phys J E Soft Matter. 2006. PMID: 17149547
-
Adhesion signals of phospholipid vesicles at an electrified interface.J Membr Biol. 2012 Sep;245(9):573-82. doi: 10.1007/s00232-012-9469-8. Epub 2012 Jul 19. J Membr Biol. 2012. PMID: 22811281
-
Understanding dynamic changes in live cell adhesion with neutron reflectometry.Mod Phys Lett B. 2014 Dec 10;28(30):1430015. doi: 10.1142/S0217984914300154. Mod Phys Lett B. 2014. PMID: 25705067 Free PMC article.
-
Mouse fibroblast cell adhesion studied by neutron reflectometry.Biophys J. 2010 Mar 3;98(5):793-9. doi: 10.1016/j.bpj.2009.11.019. Biophys J. 2010. PMID: 20197032 Free PMC article.
-
Biophysical effects of electric fields on membrane water interfaces: a mini review.Eur Biophys J. 2007 Nov;36(8):967-72. doi: 10.1007/s00249-007-0168-9. Epub 2007 May 11. Eur Biophys J. 2007. PMID: 17492435 Review.
References
-
- Als-Neilson, J., and K. Kjaer. 1989. X-ray reflectivity and diffraction studies of liquid surfaces and surfactant monolayers. In Phase Transitions in Soft Condensed Matter. T. Riste and D. Sherrington, editors. Plenum Press, New York. 113–138.
-
- Ankner, J. F., and C. F. Majkrzak. 1992. Subsurface profile refinement for neutron specular reflectivity. In S.P.I.E. Conference Proceedings, Vol. 1738. C. F. Majkrzak and J. L. Wood, editors. S.P.I.E., Bellingham, WA.
-
- Barenholz, Y., D. Gibbes, and B. J. Litman. 1977. A simple method for the preparation of homogeneous phospholipids vesicles. Biochemistry. 16:2806–2810. - PubMed
-
- Bizzotto, D., and A. Nelson. 1998. Continuing electrochemical studies of phospholipids monolayers of dioleoyl phosphatidylcholine at the mercury-electrolyte interface. Langmuir. 14:6269–6273.
Publication types
MeSH terms
Substances
LinkOut - more resources
Full Text Sources
Medical
