Comparative Study
. 2004 Mar;86(3):1794-806.
doi: 10.1016/S0006-3495(04)74246-0.

Nanometer analysis of cell spreading on matrix-coated surfaces reveals two distinct cell states and STEPs

Affiliations
Comparative Study

Nanometer analysis of cell spreading on matrix-coated surfaces reveals two distinct cell states and STEPs

Benjamin J Dubin-Thaler et al. Biophys J. 2004 Mar.

Abstract

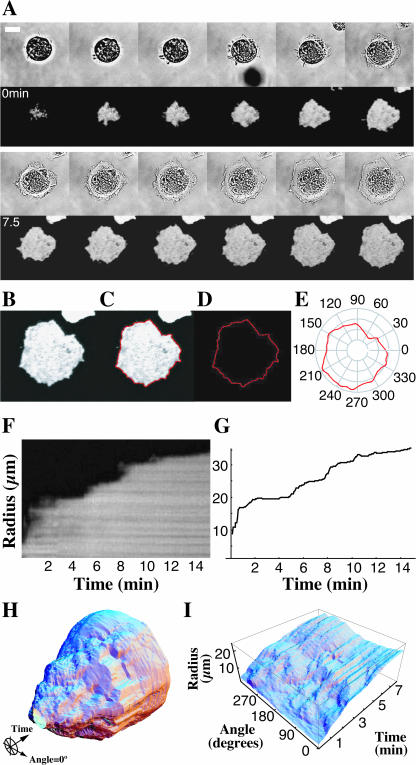
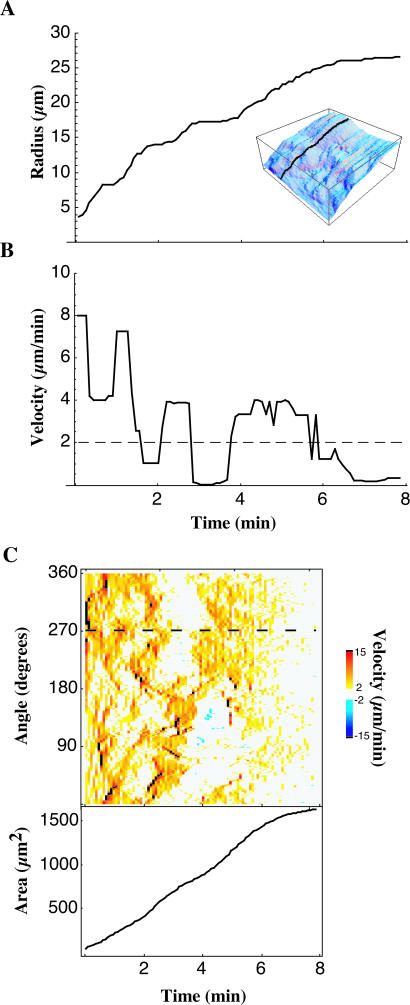
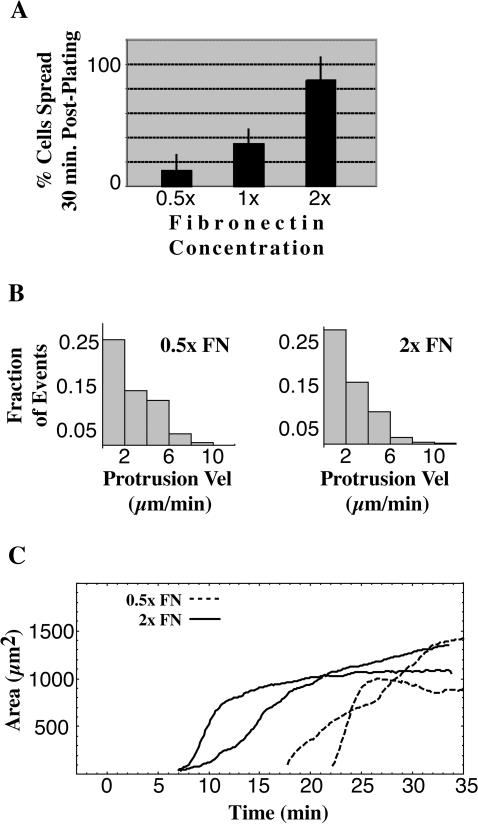
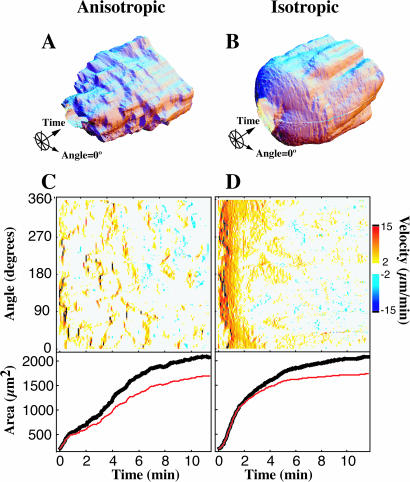
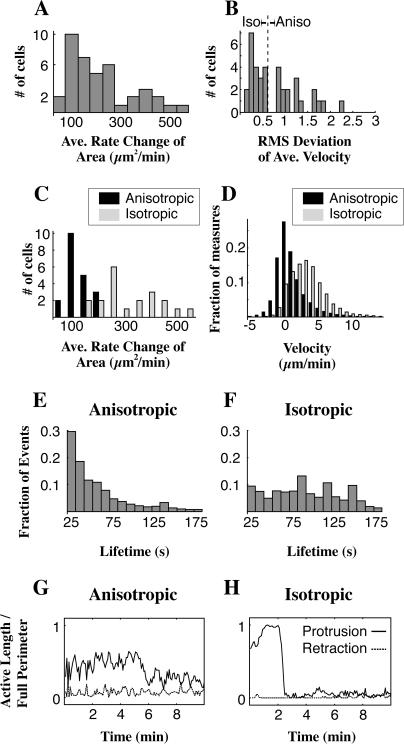
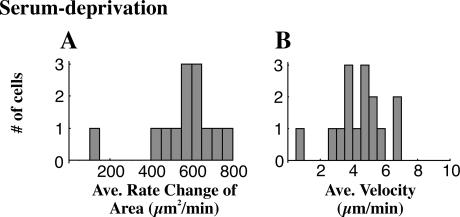
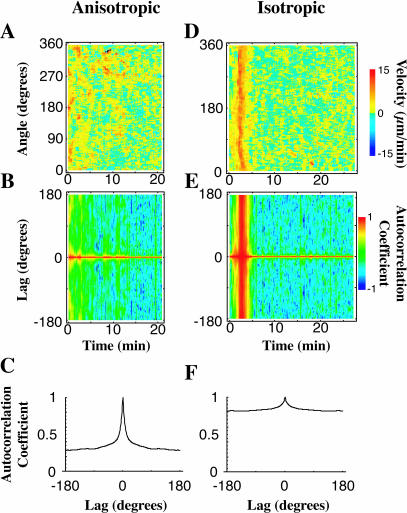
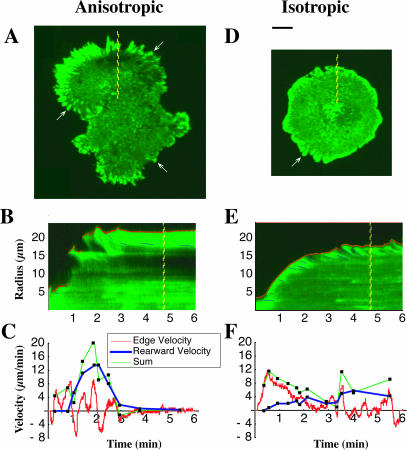
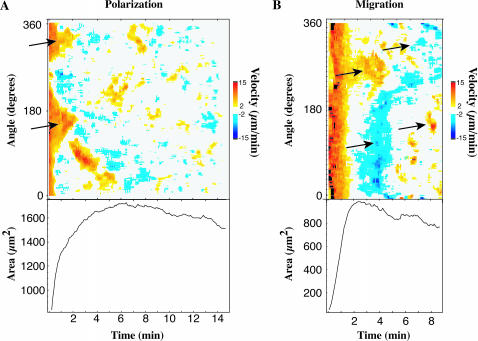
When mouse embryonic fibroblasts in suspension contact a matrix-coated surface, they rapidly adhere and spread. Using total internal reflection fluorescence microscopy of dye-loaded fibroblasts to quantify cell-substrate contact, we found that increasing the surface matrix density resulted in faster spreading initiation whereas lamellipodial dynamics during spreading were unaltered. After spreading initiation, most cells spread in an anisotropic manner through stochastic, transient extension periods (STEPs) with approximately 30 STEPs over 10 min to reach an area of 1300 micro m(2) +/- 300 micro m(2). A second mode of spreading, increased in serum-deprived cells, lacked STEPs and spread in a rapid, isotropic manner for 1-4 min. This isotropic mode was characterized by a high rate of area increase, 340 micro m(2)/min with 78% of the cell edge extending. Anisotropic cells spread slower via STEPs, 126 micro m(2)/min with 34% of the edge extending. During the initial 2-4 min of fast, isotropic spreading, centripetal flow of actin was low (0.8 micro m/min) whereas in anisotropic cells it was high from early times (4.7 micro m/min). After initial isotropic spreading, rearward actin movement increased and isotropic cells displayed STEPs similar to anisotropic cells. Thus, the two cell states display dramatically different spreading whereas long-term motility is based on STEPs.


Figures

FIGURE 1
FIGURE 1
Computer visualization of spreading in space and time. A time-lapse series of bright-field (A, upper series) and total internal reflection fluorescence (TIRF) microscope images (A, lower series) of a calcein AM-loaded fibroblast spreading from suspension onto a fibronectin-coated substrate (scale bar = 20 μm, 75 s between frames, 15 min total length). Individual TIRF images (B) were analyzed via a program that found the border between fluorescent cell and background (C and D) and then expressed this border in polar coordinates (E). F shows the traditional method for measuring motility via a kymograph that gives a plot of radius as a function of time along a single line perpendicular to the cell edge. Our method reproduces data in this single spatial dimension (G). Our technique allows us to easily visualize the time course of cell spreading in two spatial dimensions by displaying the entire sequence in cylindrical coordinates with radius as a function of angle and time (H). To view spreading of an entire cell at the same time, we express radius as a function of angle and time in Cartesian coordinates (I).
FIGURE 2
FIGURE 2
Spreading proceeds by stochastic, transient extension periods (STEPs). The early spreading of the lamellipodia is characterized by these STEPs, apparent when examining radius as a function of time along a given ray (A, inset indicates angle shown with respect to Fig. 1 I). STEPs are interspersed with periods of quiescence of the cell periphery. Edge velocity at a given time is measured by taking the derivative of radius with respect to time (B). Applying a threshold on the velocity (horizontal dashed line, B), individual STEPs can be isolated. In C, color codes for the velocity of a spreading cell (top) are shown along with the area of the cell (bottom). The horizontal dashed line in C shows the angle at which the radius versus time curve (A) and velocity versus time curve (B) are taken.
FIGURE 3
FIGURE 3
Fibronectin concentration modulates spreading initiation. The percent of spread cells at 30 min is an increasing function of fibronectin (FN) concentration up to a peak concentration (A, bars indicate SD). This increase in number of spread cells does not correlate with an increase in the velocity of protrusions of the spreading cells (B). This suggests that whereas FN catalyzes spreading initiation, it does not play a role in regulating the velocity of the spreading edge. The two representative cells spreading on 2× fibronectin (C, solid curves) and two representative cells on 0.5× fibronectin (C, dashed curves) show the time delay caused by decreasing fibronectin concentration.
FIGURE 4
FIGURE 4
Two modes of spreading: anisotropic and isotropic. Comparing the three-dimensional time plots of the spreading cell edge of a typical anisotropic spreading cell (A) versus a typical isotropic spreading cell (B) reveals spreading by STEPs throughout anisotropic spreading, although STEPs appear in the isotropic cell only after 2 min. Above-threshold edge velocities of the anisotropic (C, top) and isotropic cells (D, top) clearly display these two modes. Both cells reach the same total area (C and D, bottom, black curves) and the majority (>75%) of the spreading is accounted for by the above-threshold regions (C and D, bottom, red curves).
FIGURE 5
FIGURE 5
Bimodal distribution of spreading characteristics. The rate of area change for a population of cells (A, n = 40) shows a bimodal distribution; we find two peaks in the distribution near 100 and at 400 μm2/min. The average root mean-squared (RMS) deviation of the velocity over angle for the same population of cells (B) reveals a cluster of values <0.6 μm/min. When cells are grouped based on the value of their RMS deviation, either above or below 0.6 μm/min (B, vertical dashed line shows cutoff at 0.6 μm/min), the rate change of area plot (C) is divided into the two separate modes that we observed. The distribution of the average velocities of the membranes of these cells (D) shows that anisotropic spreading cells are significantly shifted toward lower velocities when compared with the velocities of the edge in the isotropic spreading cells. Measuring the duration of continuous, above-threshold protrusive regions in a group of 20 anisotropic cells (E) reveals a fast decay in lifetimes of spreading events for anisotropic spreading cells that is fit well by an exponential decay. Duration measurement in 20 isotropic cells (F) reveals a much broader distribution caused by the 1- to 3-min-long burst of continuous spreading characteristic of isotropic spreading cells. The fraction of the edge protruding in a representative anisotropic cell (G, solid curve) lacks the early peak in protrusion activity seen in the isotropic cell (H, solid curve). In the anisotropic cell, retraction and quiescence of the cell edge is seen from the onset of spreading (G, dashed curve), whereas for the representative isotropic spreading cell there is little detectable retraction of the cell edge until 6 min after the onset of spreading (H, dashed curve). Activity is measured as the quotient of the contour length of above-threshold regions along the edge and the total contour length along the edge.
FIGURE 6
FIGURE 6
Serum deprivation promotes isotropic spreading. Serum deprivation induces the population to behave isotropically in terms of the rate of area change (A, notice peak at 600, mean of 15 cells) although this population shows only a slight shift in its velocity as seen in a histogram of average velocities for each cell (B, mean of 15 cells).
FIGURE 7
FIGURE 7
Cross-correlation analysis suggests the stochastic nature of spreading. A velocity map for an anisotropic cell displays distinct regions of protrusion activity (A). Angular correlations of velocity at a given time (B) reveal favored angles (positive correlation) or disfavored angles (negative correlation) between regions of similar activity. Although peaks are often revealed for individual cells, the average of the autocorrelation functions for the initial spreading of 20 anisotropic cells (C) shows no discernable correlation length apart from 0 lag. Thus we surmise that protrusion initiation is randomized in space and is the result of a stochastic process. An isotropic cell's velocity map (D) exhibits a characteristic high velocity, 3-min-long isotropic expansion of the membrane onto the substrate. The corresponding autocorrelation map (E) of this cell shows a band of high correlation coinciding with the isotropic expansion. Uniformly high autocorrelation is simply a restatement of the definition of isotropism—the cell's movement is the same (is highly correlated) in all directions at the same time. An average of the autocorrelation functions of the initial spreading regions of 20 isotropic cells (F) shows no preferred angle of correlation in the population but tells us that the overall correlation is large.
FIGURE 8
FIGURE 8
Low actin rearward movement in isotropic spreading cells. Time-lapse TIRF microscopy of the spreading of transiently transfected GFP α-actinin-labeled cells revealed further information regarding the nature of the difference between anisotropic (A–C) and isotropic (DF) cells. As an indicator of focal contacts, α-actinin labeling shows that in anisotropic spreading cells (A, arrows), focal contacts matured more quickly than in isotropic cells (D, arrow). GFP α-actinin is also used as an indicator of the rearward movement of the actin cytoskeleton. Using kymographs (time-space plots in which the spatial axis is perpendicular to the cell's edge) of fluorescent time-lapse sequences for both anisotropic (B) and isotropic (E) cells, we computed the velocity of the rearward movement of α-actinin, the edge velocity, and the sum of the two in anisotropic spreading (C) and isotropic spreading (F). Rearward movement in anisotropic cells (C, blue curve) was much higher at early times compared to that of isotropic spreading cells (F, blue curve).
FIGURE 9
FIGURE 9
Quantitative view of migration and polarization. Our quantitative measure of cell edge movement is applicable to motility generally and not just cell spreading. Cells were often seen to polarize after spreading and this polarization can be seen clearly in a velocity plot (A, top, arrows) as protrusions occurring on opposite sides of the cell, and proceeded in moving via STEP-based motility. Some cells were observed to migrate soon after spreading (B, left two arrows), indicated by retracting regions of the cell 180° away from the protruding region of the cell as seen in a velocity plot for such a cell. This cell quickly began migrating in the opposite direction via STEPs (B, right two arrows). Cell area often decreased after the cell reached its fully spread area and polarized (A, bottom) or migrated (B, bottom). Both A and B show examples of how cells, including isotropic cells, eventually display STEPs in later motility processes.

References

    1. Abraham, V. C., V. Krishnamurthi, D. L. Taylor, and F. Lanni. 1999. The actin-based nanomachine at the leading edge of migrating cells. Biophys. J. 77:1721–1732. - PMC - PubMed
    1. Aplin, A. E., B. P. Hogan, J. Tomeu, and R. L. Juliano. 2002. Cell adhesion differentially regulates the nucleocytoplasmic distribution of active MAP kinases. J. Cell Sci. 115:2781–2790. - PubMed
    1. Axelrod, D., N. L. Thompson, and T. P. Burghardt. 1983. Total internal inflection fluorescent microscopy. J. Microsc. 129:19–28. - PubMed
    1. Bailly, M., J. S. Condeelis, and J. E. Segall. 1998. Chemoattractant-induced lamellipod extension. Microsc. Res. Tech. 43:433–443. - PubMed
    1. Bear, J. E., T. M. Svitkina, M. Krause, D. A. Schafer, J. J. Loureiro, G. A. Strasser, I. V. Maly, O. Y. Chaga, J. A. Cooper, G. G. Borisy, and F. B. Gertler. 2002. Antagonism between Ena/VASP proteins and actin filament capping regulates fibroblast motility. Cell. 109:509–521. - PubMed

Publication types

LinkOut - more resources