Comparative Study
. 2004 Mar;86(3):1829-42.
doi: 10.1016/S0006-3495(04)74250-2.

Modeling extracellular field potentials and the frequency-filtering properties of extracellular space

Affiliations
Comparative Study

Modeling extracellular field potentials and the frequency-filtering properties of extracellular space

Claude Bédard et al. Biophys J. 2004 Mar.

Abstract

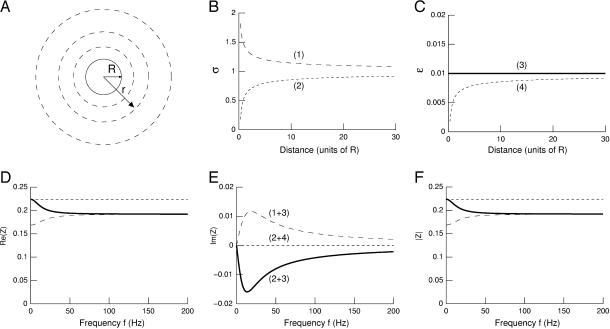
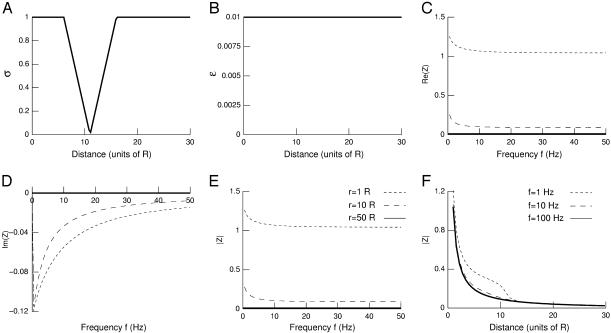
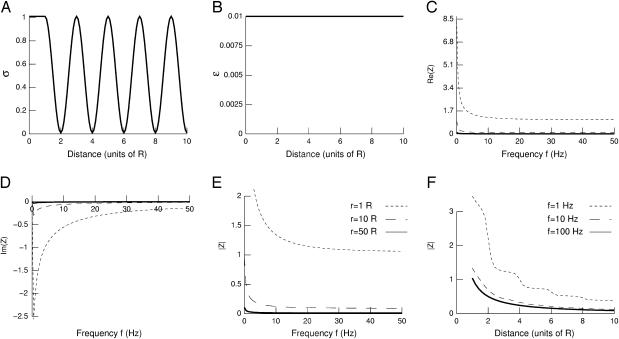
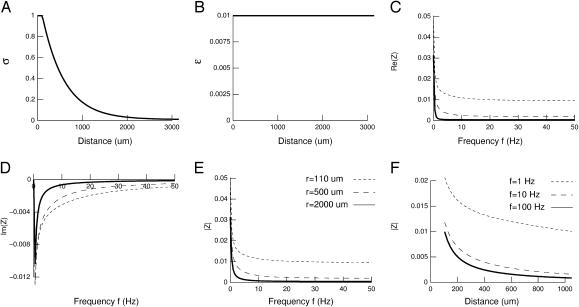
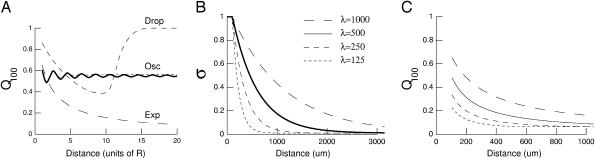
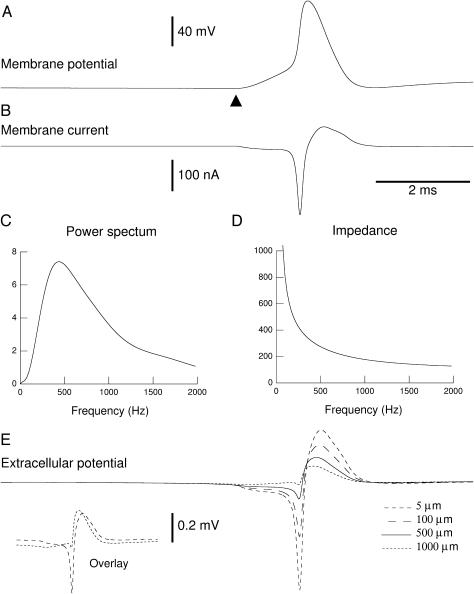
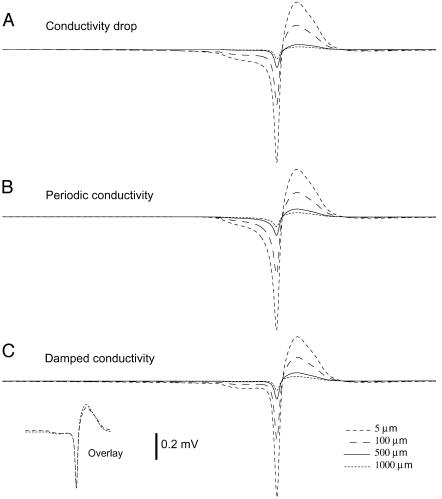
Extracellular local field potentials are usually modeled as arising from a set of current sources embedded in a homogeneous extracellular medium. Although this formalism can successfully model several properties of extracellular local field potentials, it does not account for their frequency-dependent attenuation with distance, a property essential to correctly model extracellular spikes. Here we derive expressions for the extracellular potential that include this frequency-dependent attenuation. We first show that, if the extracellular conductivity is nonhomogeneous, there is induction of nonhomogeneous charge densities that may result in a low-pass filter. We next derive a simplified model consisting of a punctual (or spherical) current source with spherically symmetric conductivity/permittivity gradients around the source. We analyze the effect of different radial profiles of conductivity and permittivity on the frequency-filtering behavior of this model. We show that this simple model generally displays low-pass filtering behavior, in which fast electrical events (such as Na(+)-mediated action potentials) attenuate very steeply with distance, whereas slower (K(+)-mediated) events propagate over larger distances in extracellular space, in qualitative agreement with experimental observations. This simple model can be used to obtain frequency-dependent extracellular field potentials without taking into account explicitly the complex folding of extracellular space.


Figures

FIGURE 1
FIGURE 1
Radial variations of conductivity and permittivity can induce frequency-filtering properties. (A) Scheme of the current source in radial symmetry. The current source is assumed to be spherical (solid line; radius R). The conductivity and permittivity vary in radial symmetry according to the distance r from the center of the source. (B) Conductivity σ versus radial distance r. Two cases are shown: (1) formula image and (2) formula image where r0 = 0.2025 R (R = 1 here). (C) Permittivity ɛ versus radial distance r. The two curves shown are: (3) ɛ(r)/σ(R) = 0.01 and (4) formula image (DF) Real part (D), imaginary part (E), and norm (F) of the impedance formula image versus frequency f. Combining the profiles (1) and (3) in B and C leads to a high-pass filter (long-dashed line), whereas (2+3) gives low-pass characteristics (solid line). The combination (2+4) is such that formula image in which case there is no frequency dependence (short-dashed line).
FIGURE 2
FIGURE 2
Frequency-filtering properties obtained by a localized drop in conductivity. (A) Profile of conductivity versus distance. The conductivity was described by formula image for formula image for formula image and formula image otherwise. (B) Profile of permittivity. formula image was constant and equal to 0.01. (CE) Real part (C), imaginary part (D), and norm (E) of the impedance as a function of frequency f. formula image is shown for different distances r away from the source. (F) Attenuation of the impedance norm formula image with distance. The different curves correspond to three different frequencies.
FIGURE 3
FIGURE 3
Frequency-filtering properties obtained from a periodically varying conductivity. (A) Oscillatory profile of conductivity versus distance formula image (B) Profile of permittivity formula image (CE) Real part (C), imaginary part (D), and norm (E) of the impedance Zω(r) versus frequency f. The different curves are taken at different distances r outside of the current source. (F) Attenuation of the impedance norm formula image with distance. The different curves indicate the attenuation obtained at different frequencies.
FIGURE 4
FIGURE 4
Frequency-filtering properties obtained with exponential decrease of conductivity. (A) Profile of conductivity. formula image decays exponentially according to formula image with a space constant formula image (B) Profile of permittivity. formula image was constant (0.01). (CE) Real part (C), imaginary part (D), and norm (E) of the impedance Zω(r) versus frequency f. The different curves show the impedance calculated at different distances r. (F) Attenuation of the impedance norm formula image with distance. The different curves indicate the attenuation obtained at different frequencies.
FIGURE 5
FIGURE 5
Distance dependence of frequency-filtering properties. (A) Ratio of impedance at fast and slow frequencies (Q100) represented as a function of distance r (units of R). The Q100 ratios are represented for different profiles of conductivity. Drop, localized drop of conductivity (short-dashed line; same parameters as in Fig. 2). Osc, oscillatory profile of conductivity (solid line; same parameters as in Fig. 3; the dotted line indicates a damped cosine oscillation). Exp, exponential decrease of conductivity (long-dashed line; same parameters as in Fig. 4 except formula image). (B) Profiles of conductivity with exponential decay (same parameters as in Fig. 4; space constants λ indicated in μm). (C) Q100 ratios obtained for the conductivity profiles shown in B.
FIGURE 6
FIGURE 6
Frequency-filtered extracellular field potentials in a conductance-based model. (A) Membrane potential of a single-compartment model containing voltage-dependent Na+ and K+ conductances and a glutamatergic synaptic conductance. The glutamatergic synapse was stimulated at t = 5 ms (▴) and evoked an action potential. (B) Total membrane current generated by this model. Negative currents correspond to Na+ and glutamatergic conductances (inward currents), whereas positive currents correspond to K+ conductances (outward currents). (C) Power spectrum of the total current shown in B. (D) Impedance at 500 μm from the current source assuming a radial profile of conductivity and permittivity (as in Fig. 4). (E) Extracellular potential calculated at various distances from the source (5, 100, 500, and 1000 μm). The frequency filtering properties can be seen by comparing the negative and positive deflections of the extracellular potential. The fast negative deflection almost disappeared at 1000 μm whereas the slow positive deflection was still present. The inset in E (Overlay) shows the traces at 5 and 1000 μm overlaid.
FIGURE 7
FIGURE 7
Frequency-filtered extracellular field potentials for different radial profiles of conductivity. The extracellular potential was calculated from a conductance-based spiking neuron model (identical to that of Fig. 6) and was shown at various distances from the source (5, 100, 500, and 1000 μm) for different profile of conductivity. (A) Localized drop in conductivity (same profile as in Fig. 2 A, with drop starting at r = 120 μm and ending at r = 280 μm). (B) Same simulation using a periodic conductivity profile (profile as in Fig. 3 A with same extremal values as in Fig. 6 and a period of 2 μm). (C) Same simulation using damped oscillations of conductivity (same parameters as in B, with a space constant of λ = 500 μm). In all cases, the attenuation of the fast negative deflection was similar to the slow positive deflection, in contrast with Fig. 6 E. The inset in C (Overlay) shows the traces at 5 and 1000 μm overlaid, which are almost superimposable (compare with inset in Fig. 6 E).

References

    1. Amzica, F. 2002. In vivo electrophysiological evidences for cortical neuron-glia interactions during slow (<1 Hz) and paroxysmal sleep oscillations. J. Physiol. (Paris). 96:209–219. - PubMed
    1. Basser, P. J., and B. J. Roth. 2000. New currents in electrical stimulation of excitable tissues. Annu. Rev. Biomed. Eng. 2:377–397. - PubMed
    1. Braitenberg, V., and A. Schüz. 1998. Cortex: statistics and geometry of neuronal connectivity, 2nd ed. Springer-Verlag, Berlin, Germany.
    1. Bremer, F. 1938. L'activité électrique de l'écorce cérébrale. Actualités Scientifiques et Industrielles. 658:3–46.
    1. Bremer, F. 1949. Considérations sur l'origine et la nature des “ondes” cérébrales. Electroencephalogr. Clin. Neurophysiol. 1:177–193. - PubMed

LinkOut - more resources