

Crystal structures of a multidrug-resistant human immunodeficiency virus type 1 protease reveal an expanded active-site cavity
- PMID: 14990731
- PMCID: PMC354404
- DOI: 10.1128/jvi.78.6.3123-3132.2004
Crystal structures of a multidrug-resistant human immunodeficiency virus type 1 protease reveal an expanded active-site cavity
Abstract
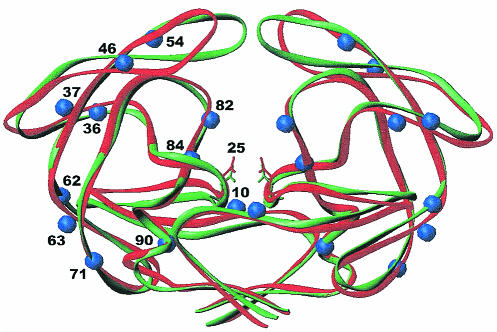
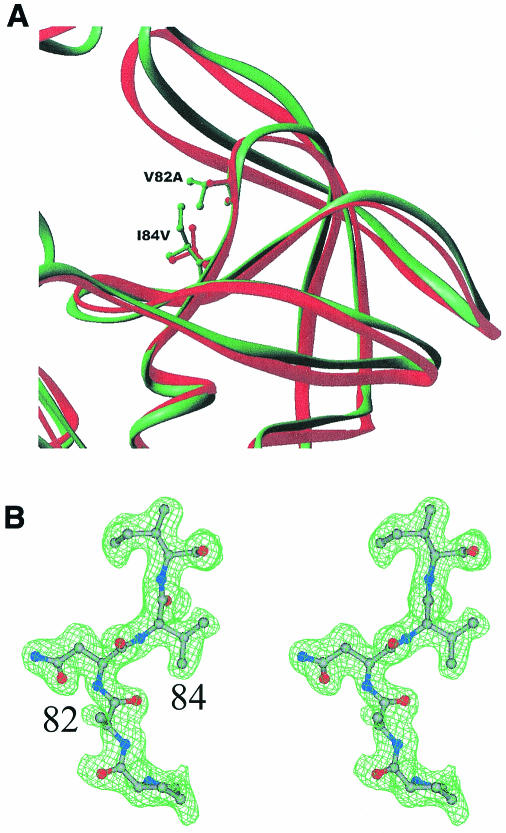
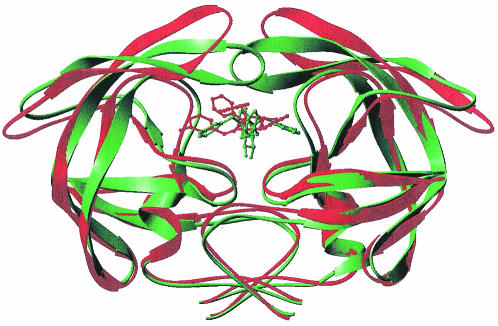
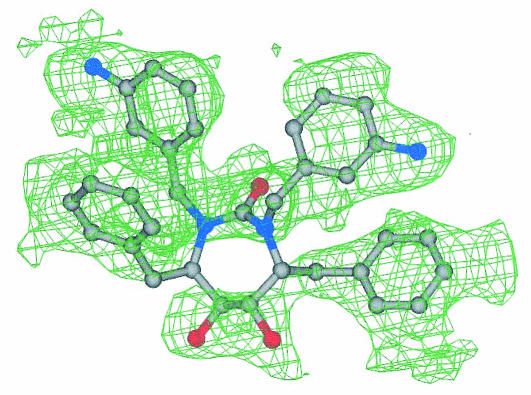
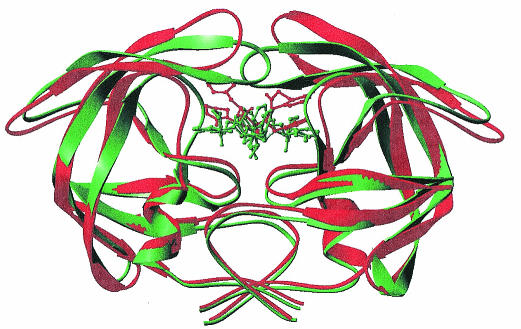
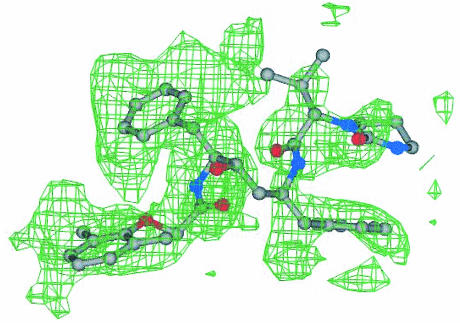
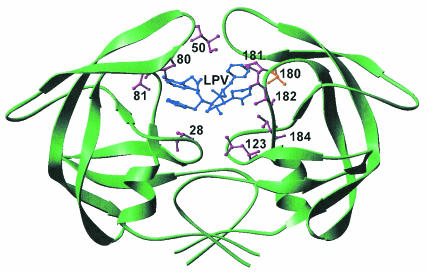
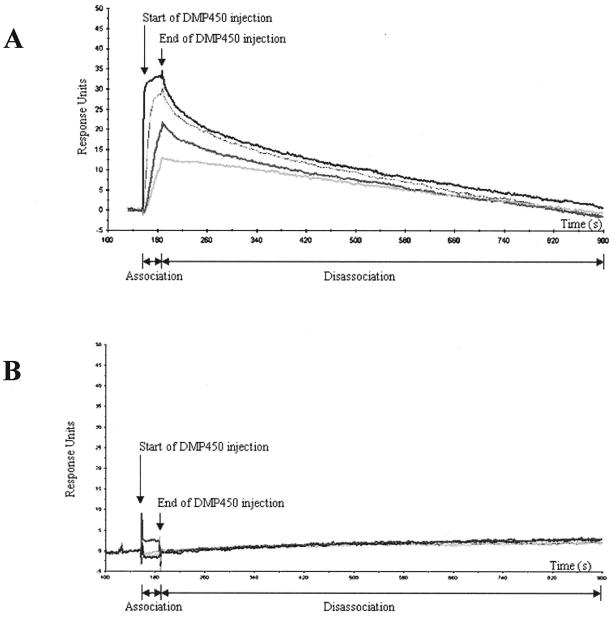
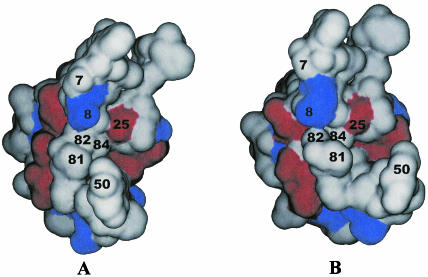
The goal of this study was to use X-ray crystallography to investigate the structural basis of resistance to human immunodeficiency virus type 1 (HIV-1) protease inhibitors. We overexpressed, purified, and crystallized a multidrug-resistant (MDR) HIV-1 protease enzyme derived from a patient failing on several protease inhibitor-containing regimens. This HIV-1 variant contained codon mutations at positions 10, 36, 46, 54, 63, 71, 82, 84, and 90 that confer drug resistance to protease inhibitors. The 1.8-angstrom (A) crystal structure of this MDR patient isolate reveals an expanded active-site cavity. The active-site expansion includes position 82 and 84 mutations due to the alterations in the amino acid side chains from longer to shorter (e.g., V82A and I84V). The MDR isolate 769 protease "flaps" stay open wider, and the difference in the flap tip distances in the MDR 769 variant is 12 A. The MDR 769 protease crystal complexes with lopinavir and DMP450 reveal completely different binding modes. The network of interactions between the ligands and the MDR 769 protease is completely different from that seen with the wild-type protease-ligand complexes. The water molecule-forming hydrogen bonds bridging between the two flaps and either the substrate or the peptide-based inhibitor are lacking in the MDR 769 clinical isolate. The S1, S1', S3, and S3' pockets show expansion and conformational change. Surface plasmon resonance measurements with the MDR 769 protease indicate higher k(off) rates, resulting in a change of binding affinity. Surface plasmon resonance measurements provide k(on) and k(off) data (K(d) = k(off)/k(on)) to measure binding of the multidrug-resistant protease to various ligands. This MDR 769 protease represents a new antiviral target, presenting the possibility of designing novel inhibitors with activity against the open and expanded protease forms.
Figures
References
-
- Ala, P. J., R. J. DeLoskey, E. E. Huston, P. K. Jadhav, P. Y. Lam, C. J. Eyermann, C. N. Hodge, M. C. Schadt, F. A. Lewandowski, P. C. Weber, D. D. McCabe, J. L. Duke, and C. H. Chang. 1998. Molecular recognition of cyclic urea HIV-1 protease inhibitors. J. Biol. Chem. 273:12325-12331. - PubMed
-
- Blundell, T. L., R. Lapatto, A. F. Wilderspin, A. M. Hemmings, P. M. Hobart, D. E. Danley, and P. J. Whittle. 1990. The 3-D structure of HIV-1 proteinase and the design of antiviral agents for the treatment of AIDS. Trends Biochem. Sci. 15:425-430. - PubMed
-
- Brunger, A. T., P. D. Adams, G. M. Clore, W. L. DeLano, P. Gros, R. W. Grosse-Kunstleve, J. S. Jiang, J. Kuszewski, M. Nilges, N. S. Pannu, R. J. Read, L. M. Rice, T. Simonson, and G. L. Warren. 1998. Crystallography & NMR system: a new software suite for macromolecular structure determination. Acta Crystallogr. D Biol. Crystallogr. 54:905-921. - PubMed
-
- Carpenter, C. C., D. A. Cooper, M. A. Fischl, J. M. Gatell, B. G. Gazzard, S. M. Hammer, M. S. Hirsch, D. M. Jacobsen, D. A. Katzenstein, J. S. Montaner, D. D. Richman, M. S. Saag, M. Schechter, R. T. Schooley, M. A. Thompson, S. Vella, P. G. Yeni, and P. A. Volberding. 2000. Antiretroviral therapy in adults: updated recommendations of the International AIDS Society-USA Panel. JAMA 283:381-390. - PubMed
-
- D'Aquila, R., J. Schapiro, F. Brun-Vezinet, B. Clotet, B. Conway, L. Demeter, C. Loveday, R. M. Grant, V. A. Johnson, D. Kuritzkes, R. W. Shafer, and D. D. Richman. 2002. Drug resistance mutations in HIV-1. Top. HIV Med. 10:21-25. - PubMed
Publication types
MeSH terms
Substances
Associated data
- Actions
- Actions
- Actions
Grants and funding
LinkOut - more resources
Full Text Sources
Other Literature Sources
