Comparative Study
. 2004 Mar 9;101(10):3480-5.
doi: 10.1073/pnas.0307827100. Epub 2004 Feb 27.

Codon usage between genomes is constrained by genome-wide mutational processes

Affiliations
Comparative Study

Codon usage between genomes is constrained by genome-wide mutational processes

Swaine L Chen et al. Proc Natl Acad Sci U S A. .

Abstract

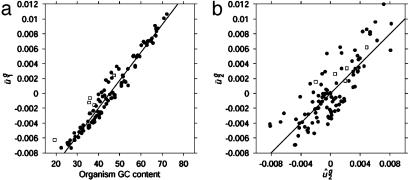
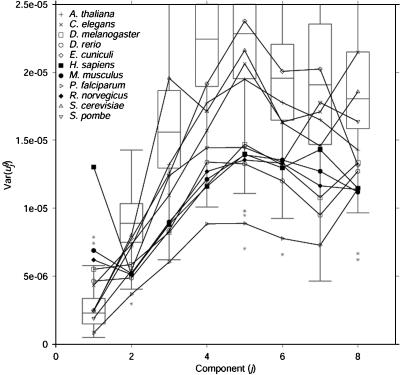
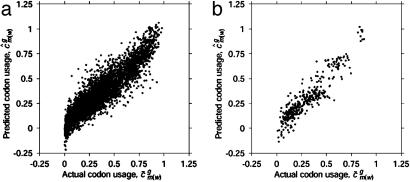
Analysis of genome-wide codon bias shows that only two parameters effectively differentiate the genome-wide codon bias of 100 eubacterial and archaeal organisms. The first parameter correlates with genome GC content, and the second parameter correlates with context-dependent nucleotide bias. Both of these parameters may be calculated from intergenic sequences. Therefore, genome-wide codon bias in eubacteria and archaea may be predicted from intergenic sequences that are not translated. When these two parameters are calculated for genes from nonmammalian eukaryotic organisms, genes from the same organism again have similar values, and genome-wide codon bias may also be predicted from intergenic sequences. In mammals, genes from the same organism are similar only in the second parameter, because GC content varies widely among isochores. Our results suggest that, in general, genome-wide codon bias is determined primarily by mutational processes that act throughout the genome, and only secondarily by selective forces acting on translated sequences.


Figures

Fig. 1.
Fig. 1.
(a) Scree plot of singular values. Singular values (σj) were obtained from a SVD of 400 genes from each of 100 genomes. (b) Contribution of var(uj)between (between-genome variance) to overall variance. Overall variance is scaled to 1 in each dimension. The rest of the overall variance is due to var(uj)within (within-genome variance). In only two dimensions, j = 1 and 2, is var(uj)between the major source of variance.
Fig. 2.
Fig. 2.
(a) Plot of formula image versus genome GC content for each organism. Usage of the first eigencodon correlates with genome GC content (R2 = 0.961). (b) Plot of formula image versus intergenic bias. The second eigencodon correlates with a model constructed as a linear combination of intergenic bias parameters (R2 = 0.669). In both plots, open boxes are data points for A. thaliana, C. elegans, E. cuniculi, P. falciparum, S. cerevisiae, and S. pombe.
Fig. 3.
Fig. 3.
Eukaryotic genomes have low variance in usage of the second eigencodon. Expanded view of box and whisker plots of formula image for j = 1,..., 8 for all prokaryotic genomes g, with values for eukaryotic genomes superimposed. A full diagram can be found in Fig. 5. Box and whisker plots are drawn in gray. Asterisks indicate outlying prokaryotic values. Values for eukaryotic organisms are drawn individually with symbols as indicated in the upper left corner. Compared with prokaryotic genomes, many eukaryotic genomes have large variance in the usage of eigencodon v1 but relatively small variance in usage of eigencodon v2. In general, variance is smaller for eukaryotic genomes than for prokaryotic genomes because eukaryotic genes tend to be longer than prokaryotic genes and hence provide less noisy samples of codon bias. Considering only long prokaryotic genes does not change the results qualitatively (see Figs. 7–9, which are published as supporting information on the PNAS web site).
Fig. 4.
Fig. 4.
Graph of components of predicted genome-wide codon bias vector, ĉg, based on intergenic nucleotide sequences versus components of actual genome-wide codon bias vector, g. Each point in the plot represents a formula image coordinate pair for some organism g and some codon m(w). formula image is a component of g, and formula image is a component of ĉg. Different organisms and codons are not differentiated in these plots. Stop codons (TAA, TAG, and TGA) and the single codons for methionine (ATG) and tryptophan (TGG) were excluded. (a) Prokaryotes. Overall R2 = 0.858. Average for individual genomes is R2 = 0.840. (b) Data for the following eukaryotes: A. thaliana, C. elegans, E. cuniculi, P. falciparum, S. cerevisiae, and S. pombe. Overall R2 = 0.847. R2 values for the individual genomes are given in the text.

References

    1. Osawa, S., Jukes, T. H., Watanabe, K. & Muto, A. (1992) Microbiol. Rev. 56, 229-264. - PMC - PubMed
    1. Grantham, R. (1980) Trends Biochem. Sci. 5, 327-331.
    1. Grantham, R., Gautier, C., Gouy, M., Mercier, R. & Pave, A. (1980) Nucleic Acids Res. 8, r49-r62. - PMC - PubMed
    1. Grantham, R., Gautier, C., Gouy, M., Jacobzone, M. & Mercier, R. (1981) Nucleic Acids Res. 9, r43-r74. - PMC - PubMed
    1. Ikemura, T. (1985) Mol. Biol. Evol. 2, 13-34. - PubMed

Publication types

LinkOut - more resources