. 2004 Mar;113(5):701-8.
doi: 10.1172/JCI19655.

Langerhans cells utilize CD1a and langerin to efficiently present nonpeptide antigens to T cells

Affiliations

Langerhans cells utilize CD1a and langerin to efficiently present nonpeptide antigens to T cells

Robert E Hunger et al. J Clin Invest. 2004 Mar.

Abstract

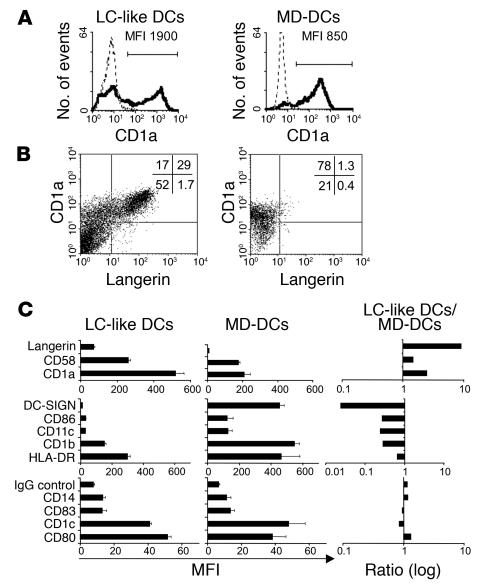
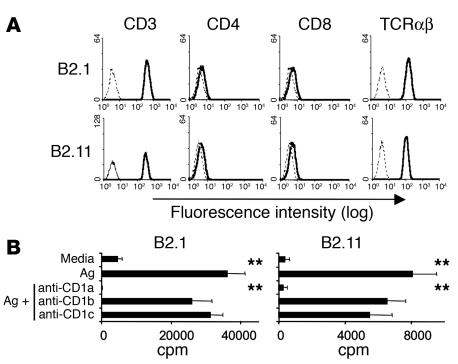
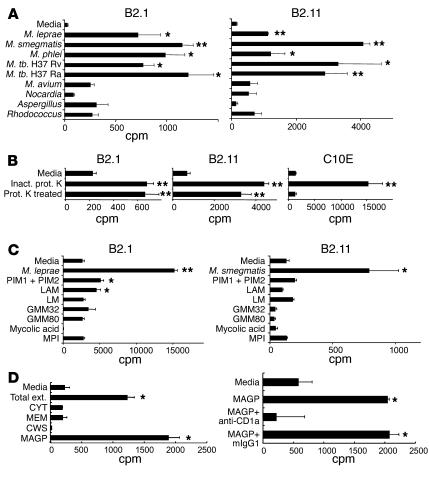
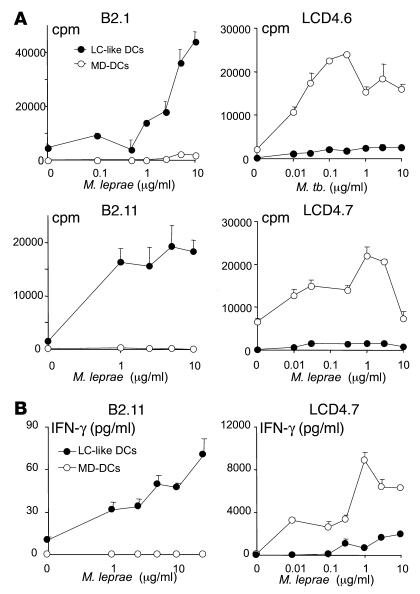
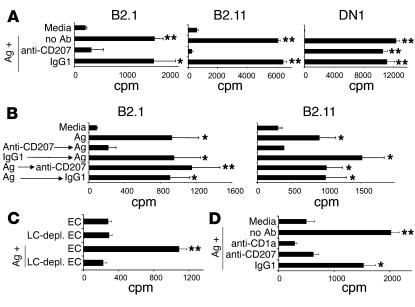
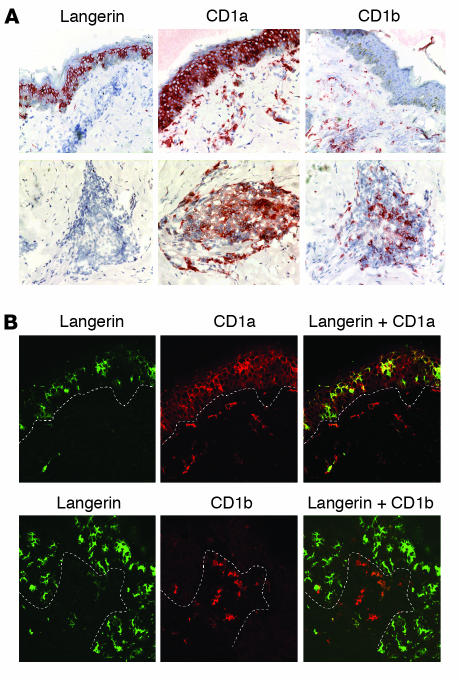
Langerhans cells (LCs) constitute a subset of DCs that initiate immune responses in skin. Using leprosy as a model, we investigated whether expression of CD1a and langerin, an LC-specific C-type lectin, imparts a specific functional role to LCs. LC-like DCs and freshly isolated epidermal LCs presented nonpeptide antigens of Mycobacterium leprae to T cell clones derived from a leprosy patient in a CD1a-restricted and langerin-dependent manner. LC-like DCs were more efficient at CD1a-restricted antigen presentation than monocyte-derived DCs. LCs in leprosy lesions coexpress CD1a and langerin, placing LCs in position to efficiently present a subset of antigens to T cells as part of the host response to human infectious disease.


Figures

Figure 1
Figure 1
Phenotype of cord blood–derived LC-like DCs and MD-DCs. (A) LC-like DCs and MD-DCs were stained with mAb’s specific for CD1a (solid line) and mouse IgG control antibody (dashed line). MFI is indicated for the positive cell population. (B) LC-like DCs and MD-DCs were double-stained with mAb’s specific for CD1a and langerin. The numbers indicate the percentage of cells in each quadrant. One representative experiment is shown from four independent donors. (C) LC-like DCs and MD-DCs were stained with numerous surface proteins. MFI was determined by flow cytometry. For each data point, cells from three different donors were analyzed (± SEM). The ratios of MFI from LC-like DCs to MFI from MD-DCs were calculated and shown on a log scale as indicated.
Figure 2
Figure 2
Phenotype and restriction pattern of antigen-specific T cell clones. (A) T cell lines B2.1 and B2.11 were analyzed for surface expression of CD3, CD4, CD8, and TCRαβ. (B) Cells were cultured with irradiated LC-like DCs in the presence or absence of antigen (Ag; sonicated M. leprae) with or without blocking antibodies as indicated. T cells were pulsed with 3H-thymidine after 72 hours of culture. Cells were harvested, and 3H incorporation was measured by a scintillation counter. The values shown are the mean ± SEM of triplicate cultures and are representative of at least three independent experiments. Student’s t test was used to compare cpm values of T cells stimulated with antigen alone versus antigen plus neutralizing antibodies. **P < 0.005.
Figure 3
Figure 3
Specificity of the proliferative responses of CD1a-restricted T cell clones to different bacterial lysates and known CD1-restricted antigens. (A) T cell lines were tested for their ability to recognize different total bacterial sonicates. M. tb., M. tuberculosis. (B) M. leprae sonicate preparation was digested with proteinase K. The proliferative response was determined using CD1a-restricted T cell line B2.1, B2.11 and the MHC class II–restricted cell line C10E. Inact. prot. K indicates that the enzyme was heat-inactivated prior to adding to bacterial extract. (C) Proliferative response was measured using different known CD1b- and CD1c-restricted antigens. Proliferative responses were measured as described for Figure 2 using LC-like DCs as APCs for T cell clones B2.1 and B2.11 and MHC-matched PBMCs for the C10E T cell line. PIM, phosphatidyl-myo-inositol mannoside; LAM, lipoarabinomannan; LM, lipomannan; GMM, glucose monomycolate; MPI, mannosyl phosphoisoprenoid. (D) Characterization of mycobacterial antigen for CD1a-restricted T cells. Left: CD1a-restricted T cell clone B2.11 was cultured with three mycobacterial extracts containing cytosol (CYT), membrane (MEM), soluble cell wall material (CWS), and mycolyl arabinogalactin peptidoglycan (MAGP). Total ext., mycobacterial extract prior to fractionation. Right: T cell–responsive MAGP was examined for CD1a-restriction using neutralizing antibodies to CD1a. The values shown are the mean ± SEM of triplicate cultures and are representative of at least three independent experiments. Statistical analysis was performed as indicated in the legend to Figure 2, but comparing T cells stimulated with media versus antigen. *P < 0.05; **P < 0.005.
Figure 4
Figure 4
Comparison of antigen presentation by LC-like DCs and MD-DCs. LC-like DCs (filled symbols) or MD-DCs (open symbols) were incubated with T cells in the presence of the indicated amount of M. leprae or M. tuberculosis sonicates. (A) Proliferation was measured as described for Figure 2. (B) IFN-γ production was measured as described in Methods. The values shown are the mean ± SEM of triplicate cultures and are representative of at least three independent experiments.
Figure 5
Figure 5
Influence of langerin (CD207) on antigen presentation in cord blood–derived LC-like DCs and freshly isolated epidermal LCs. (A) LC-like DCs, preincubated with anti-CD207 antibodies or mouse IgG1, were cocultured with CD1a-restricted T cell clones B2.1 and B2.11 and CD1b-restricted T cells (line DN1) in the presence or absence of antigen (M. leprae sonicate for B2.1 and B2.11, M. tuberculosis sonicate for DN1). Proliferation was measured as described for Figure 2. (B) LC-like DCs were pulsed for 4 hours with antigen (M. leprae sonicate) or with media and cocultured with CD1a-restricted T cells. Anti-CD207 antibodies were added before (anti-CD207 → Ag) or after (Ag → anti-CD207) pulsing of the LC-like DCs with antigen. Proliferation was measured as described for Figure 2. (C) CD1a-restricted T cells (clone B2.11) were cocultured with epidermal cell suspension (EC) or EC depleted of LCs (LC-depl. EC) in the presence or absence of antigen (M. leprae sonicate, 5 μg/ml). Proliferation was measured as described for Figure 2. (D) EC, preincubated with the indicated antibodies or mouse IgG1, was cocultured with CD1a-restricted T cells (clone B2.11) in the presence or absence of antigen. Proliferation was measured as described for Figure 2. The values shown are the mean ± SEM of triplicate cultures and are representative of at least three (A) or two (B–D) independent experiments. Statistical analysis was performed as indicated in the legend to Figure 2, but comparing T cells stimulated with media versus antigen. *P < 0.05; **P < 0.005.
Figure 6
Figure 6
LCs express both CD1a and langerin in vivo. (A) Expression of langerin (left panels), CD1a (middle panels), and CD1b (right panels) in the epidermis (upper panels) and the dermis (lower panels) of the skin lesion of a leprosy patient. The images represent sections from the lesion of one patient showing the same region of the epidermis (upper panels) and the same granuloma (lower panels). Original magnification, ×200. (B) Colocalization of langerin and CD1a in the epidermis of a leprosy skin lesion. The dotted line indicates the margin between the epidermis (top) and the dermis (bottom). Original magnification, ×200.

Comment in

References

    1. Klareskog L, Tjernlund U, Forsum U, Peterson PA. Epidermal Langerhans cells express Ia antigens. Nature. 1977;268:248–250. - PubMed
    1. Rowden G, Lewis MG, Sullivan AK. Ia antigen expression on human epidermal Langerhans cells. Nature. 1977;268:247–248. - PubMed
    1. Romani N, et al. Presentation of exogenous protein antigens by dendritic cells to T cell clones. Intact protein is presented best by immature, epidermal Langerhans cells. J. Exp. Med. 1989;169:1169–1178. - PMC - PubMed
    1. Cohen PJ, Katz SI. Cultured human Langerhans cells process and present intact protein antigens. J. Invest. Dermatol. 1992;99:331–336. - PubMed
    1. Fithian E, et al. Reactivity of Langerhans cells with hybridoma antibody. Proc. Natl. Acad. Sci. U. S. A. 1981;78:2541–2544. - PMC - PubMed

Publication types

MeSH terms