. 2004 Mar;14(3):331-42.
doi: 10.1101/gr.2094104.

Novel RNAs identified from an in-depth analysis of the transcriptome of human chromosomes 21 and 22

Affiliations

Novel RNAs identified from an in-depth analysis of the transcriptome of human chromosomes 21 and 22

Dione Kampa et al. Genome Res. 2004 Mar.

Abstract

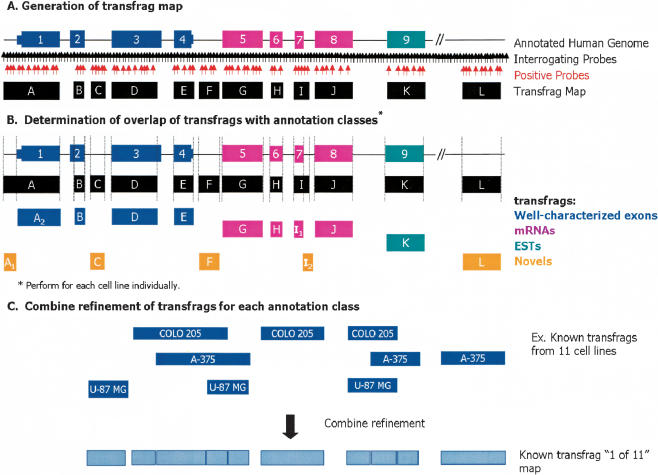
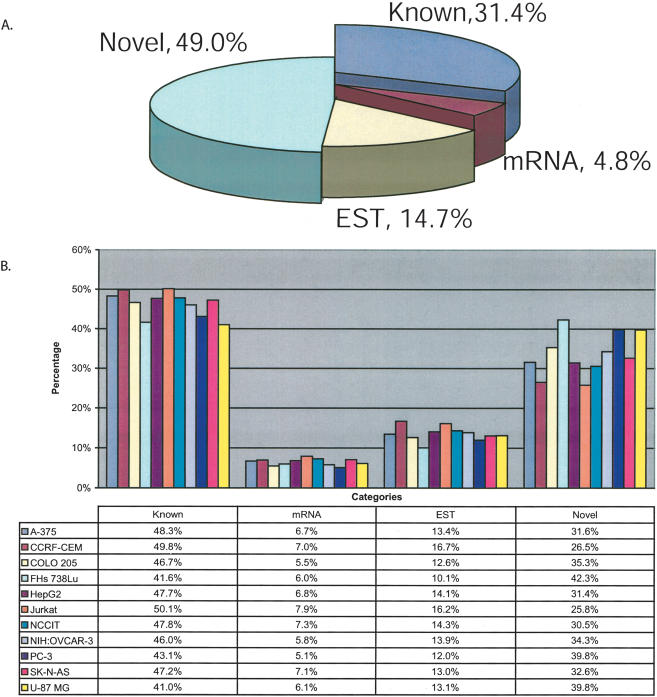
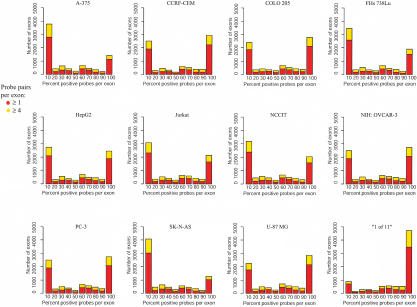
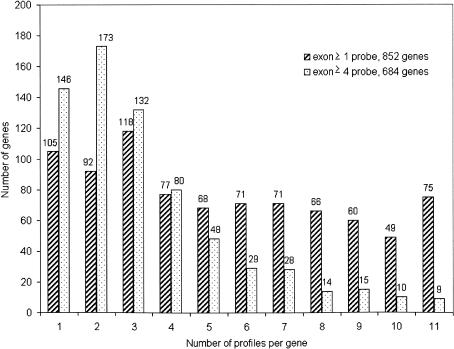
In this report, we have achieved a richer view of the transcriptome for Chromosomes 21 and 22 by using high-density oligonucleotide arrays on cytosolic poly(A)(+) RNA. Conservatively, only 31.4% of the observed transcribed nucleotides correspond to well-annotated genes, whereas an additional 4.8% and 14.7% correspond to mRNAs and ESTs, respectively. Approximately 85% of the known exons were detected, and up to 21% of known genes have only a single isoform based on exon-skipping alternative expression. Overall, the expression of the well-characterized exons falls predominately into two categories, uniquely or ubiquitously expressed with an identifiable proportion of antisense transcripts. The remaining observed transcription (49.0%) was outside of any known annotation. These novel transcripts appear to be more cell-line-specific and have lower and less variation in expression than the well-characterized genes. Novel transcripts were further characterized based on their distance to annotations, transcript size, coding capacity, and identification as antisense to intronic sequences. By RT-PCR, 126 novel transcripts were independently verified, resulting in a 65% verification rate. These observations strongly support the argument for a re-evaluation of the total number of human genes and an alternative term for "gene" to encompass these growing, novel classes of RNA transcripts in the human genome.


Figures

Figure 1
Figure 1
Schematic representation of tiled probe pairs and generation of transfrags from human Chromosomes 21 and 22 oligonucleotide arrays. Schematic representation of oligonucleotide arrays interrogating the entire nonrepetitive regions of human Chromosomes 21 and 22 with probes regularly spaced at ∼35-bp intervals. (A) Generation of transfrag map. At each probe position, a bandwidth of 50 was used to determine positive probes above a threshold of 150 (indicated in red) wherein the pseudo-median values for each position are recomputed as a pseudo-median of all probes in the window using the Hodges-Lehmann estimator. Fragments of contiguously transcribed elements termed transfrags were generated by joining positive probes that were separated by a certain distance (maxgap = 40) and whose length was less than a particular size (minrun = 90). (B) Portions of transfrags based on annotations. The transfrags were delineated into the following classes based on their overlap with a predefined set of annotations: (1) well-characterized exons (dark blue); (2) mRNAs (pink); and (3) ESTs (green). Any observed transcription outside of these annotation classes was considered novel (orange). The vertical lines indicate the boundaries of the transfrags. (C) Combined refinement of transfrags for each annotation class. Following this classification, all transfrags that belong to a particular class are combined to form a comprehensive nonoverlapping union of transfrags termed a “1 of 11” map.
Figure 2
Figure 2
Characterization of all transfrags based on annotations. Transfrags from all 11 cell lines were classified based on their base pair overlap with annotations. The annotations are (1) Known, overlapping with known annotations (compiled by UCSC Genome Browser based on protein-coding genes from SWISS-PROT, TrEMBL, and TrEMBL-NEW); (2) mRNA, overlapping with mRNAs and not known; (3) ESTs, overlapping with ESTs and not known or mRNAs; and (4) Novel, not overlapping known exons, mRNAs, or ESTs. (A) Pie chart representing all transfrags from “1 of 11” map. (B) Bar graph shows the percentage of all transfrags from each of the 11 cell lines by annotation class. An overlap of even a single base pair is considered as an intersect between the transfrag and annotation.
Figure 3
Figure 3
Distribution of positive probes in exons. The distribution of the percent of positive probes in exons is plotted by cell line as well as for the “1 of 11” map. The red bars represent all interrogated exons, and the yellow bars represent exons that contain four more interrogating probe pairs.
Figure 4
Figure 4
Distribution of genes by isoforms. An “on/off” profile was determined for each exon in all genes on the array. An exon was “on” if at least 30% of the interrogating probe pairs were positive. The histogram shows the count of profiles for each gene in all cell lines. The maximum number of profiles was 11, indicating that a particular gene has a different “on/off” pattern of exons. The minimal number of profiles was 1, indicating that a particular gene has the same “on/off” exon pattern in all 11 cell lines tested. The blue bars represent all exons with at least 30% of the interrogating probe pairs positive. The red bars represent exons that contain four or more interrogating probe pairs with at least 30% of the interrogating probe pairs positive. The numbers above the bars indicate the number of genes that contain the specified number of profiles. Of 852 genes, 75 genes have 11 profiles when considering all exons, and nine genes out of 684 have 11 profiles when considering exons with at least four probes.
Figure 5
Figure 5
Analysis of the expression and variance of known and novel transcription across all 11 cell lines. (A) Expression of known and novel transcription from 11 cell lines by the percentage of total nucleotides within the total (black), known (blue), and novel (red) transfrags according to the number of cell lines expressing that transfrag. (B) Estimation of the degree of differential expression across the 11 cell lines. An F-statistic was calculated for each transfrag by the variance of the average pseudo-median value in each transfrag between cell lines divided by the average of the within cell line variation of the pseudo-median value in that transfrag.
Figure 6
Figure 6
Fragment size versus distance to annotation of novel transfrags. (A) The distribution of the size of the novel transfrags from A375 relative to the genome annotations (exons, mRNAs, ESTs). Location is determined by the distance to the nearest known exon in either the 5′ (–) or 3′ (+) direction. (B) Distribution of novel transfrags from the “1 of 11” map. The incremental pattern of transfag sizes reflects the 35 bp spacing of probes.
Figure 7
Figure 7
Northern blot analysis of novel regions. For Northern blots, 12 μg of cytosolic RNA and the poly(A)+ fraction from each of the specified cell lines was loaded on the gel. The filters were hybridized with radiolabeled DNA probes corresponding to the cloned RT-PCR products derived from the novel array-predicted transcribed regions described in both the present and previous reports (Kapranov et al. 2002).

References

    1. Bolstad, B.M., Irizarry, R.A., Astrand, M., and Speed, T.P. 2003. A comparison of normalization methods for high density oligonucleotide array data based on variance and bias. Bioinformatics 19: 185–193. - PubMed
    1. Cawley, S., Bekiranov, S., Ng, H., Kapranov, P., Sekinger, E.A., Kampa, D., Piccolboni, A., Sementchenko, V., Cheng, J., Williams, A., et al. 2004. Unbiased mapping of transcription factor binding sites along human chromosomes 21 and 22 point to widespread regulation of non-coding RNAs. Cell (in press). - PubMed
    1. Chen, J., Sun, M., Lee, S., Zhou, G., Rowley, J.D., and Wang, S.M. 2002. Identifying novel transcripts and novel genes in the human genome by using novel SAGE tags. Proc. Natl. Acad. Sci. 99: 12257–12262. - PMC - PubMed
    1. Collins, J.E., Goward, M.E., Cole, C.G., Smink, L.J., Huckle, E.J., Knowles, S., Bye, J.M., Beare, D.M., and Dunham, I. 2003. Reevaluating human gene annotation: A second generation analysis of human Chromosome 22. Genome Res. 13: 27–36. - PMC - PubMed
    1. Conrad, C., Vianna, C., Freeman, M., and Davies, P. 2002. A polymorphic gene nested within an intron of the τ gene: Implications for Alzheimer's disease. Proc. Natl. Acad. Sci. 99: 7751–7756. - PMC - PubMed

Publication types

Associated data

LinkOut - more resources