. 2004 Mar 1;164(5):747-58.
doi: 10.1083/jcb.200312045.

Sox5 and Sox6 are needed to develop and maintain source, columnar, and hypertrophic chondrocytes in the cartilage growth plate

Affiliations

Sox5 and Sox6 are needed to develop and maintain source, columnar, and hypertrophic chondrocytes in the cartilage growth plate

Patrick Smits et al. J Cell Biol. .

Abstract

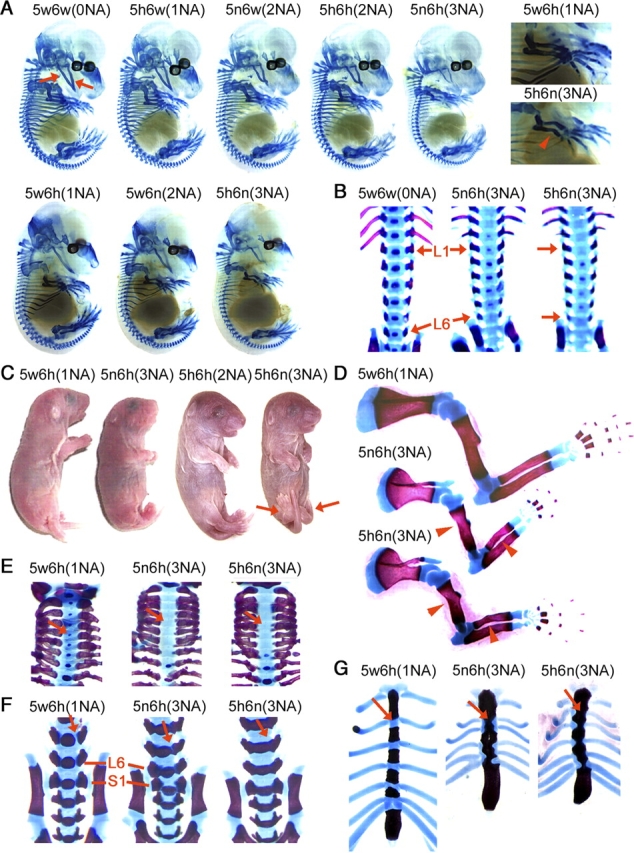
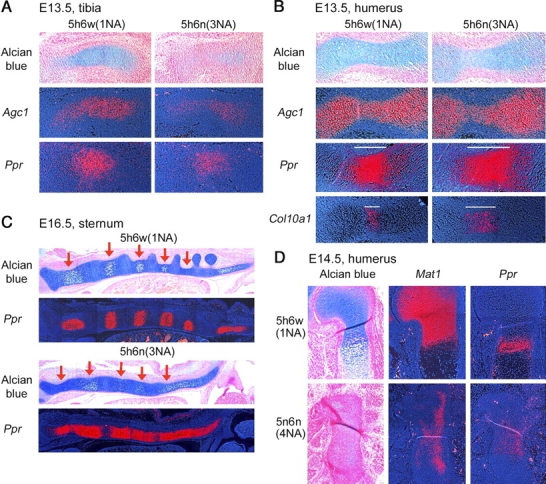
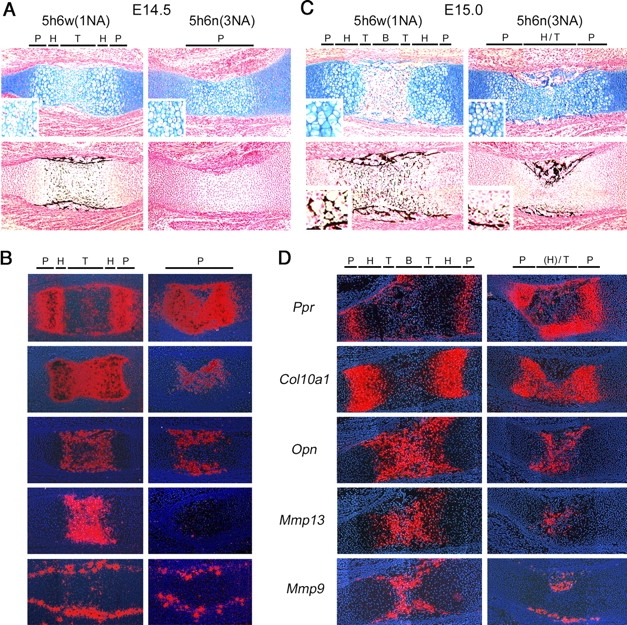
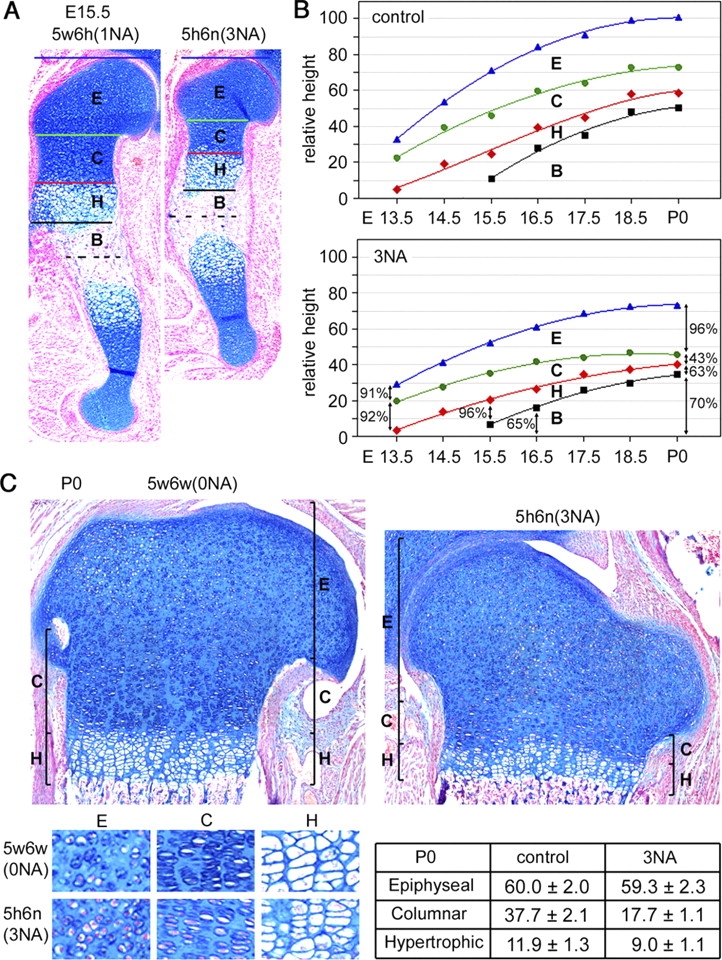
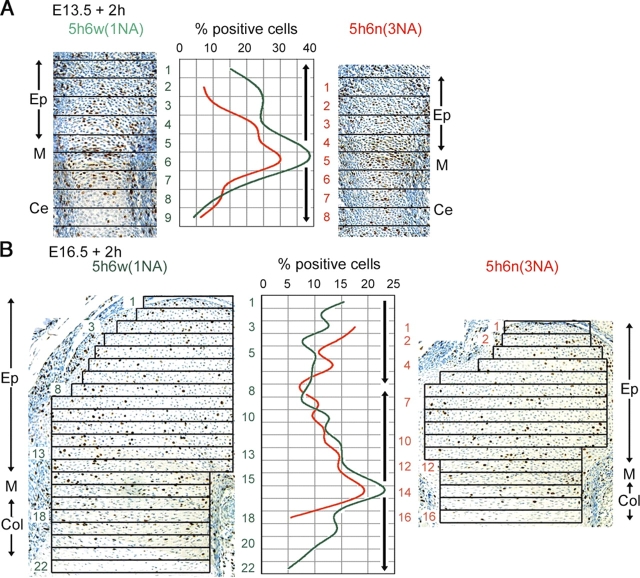
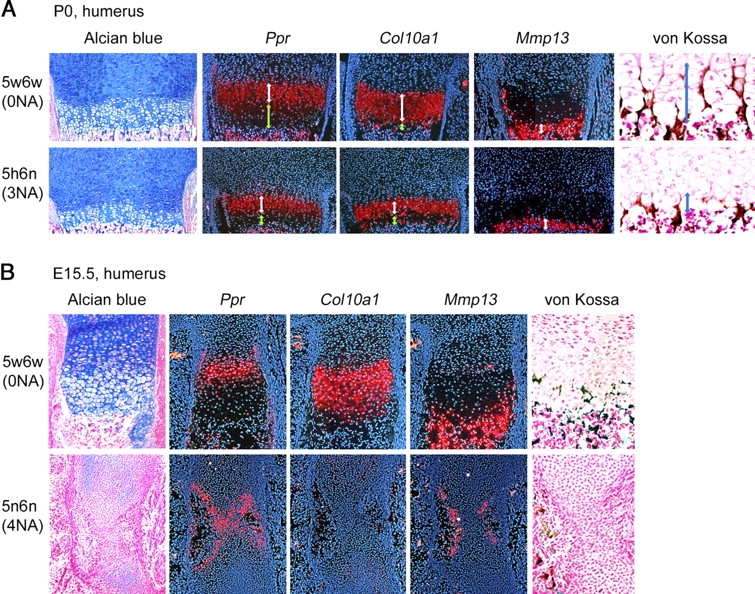
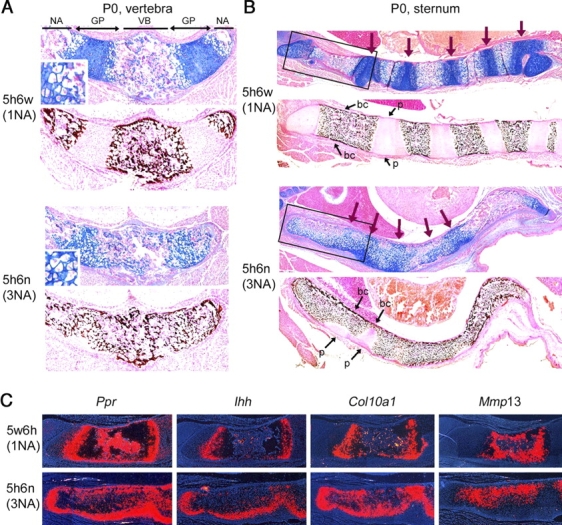
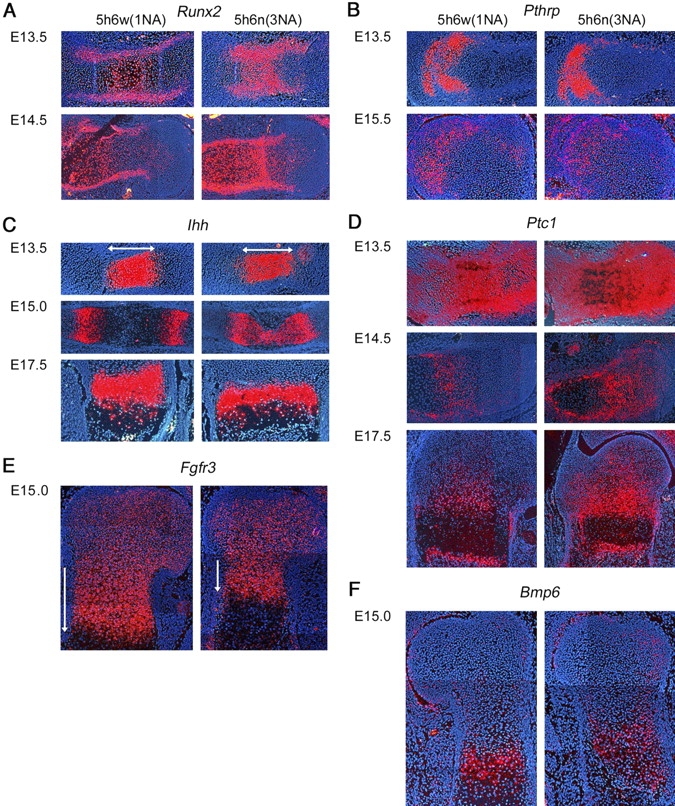
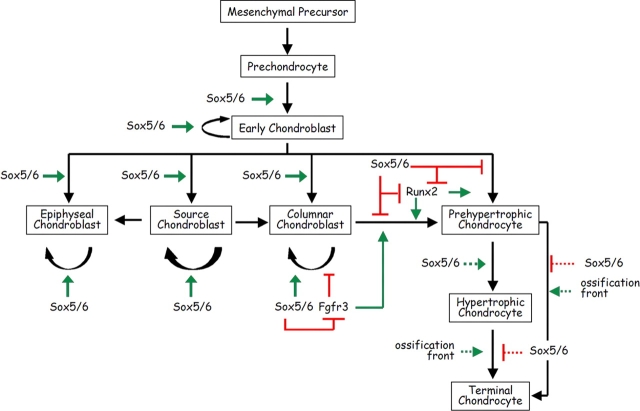
Sox5 and Sox6 encode Sry-related transcription factors that redundantly promote early chondroblast differentiation. Using mouse embryos with three or four null alleles of Sox5 and Sox6, we show that they are also essential and redundant in major steps of growth plate chondrocyte differentiation. Sox5 and Sox6 promote the development of a highly proliferating pool of chondroblasts between the epiphyses and metaphyses of future long bones. This pool is the likely cellular source of growth plates. Sox5 and Sox6 permit formation of growth plate columnar zones by keeping chondroblasts proliferating and by delaying chondrocyte prehypertrophy. They allow induction of chondrocyte hypertrophy and permit formation of prehypertrophic and hypertrophic zones by delaying chondrocyte terminal differentiation induced by ossification fronts. They act, at least in part, by down-regulating Ihh signaling, Fgfr3, and Runx2 and by up-regulating Bmp6. In conclusion, Sox5 and Sox6 are needed for the establishment of multilayered growth plates, and thereby for proper and timely development of endochondral bones.


Figures

Figure 1.
Figure 1.
Chondrodysplasia features of 3NA mice. Genotypes are designated as follows: 5, Sox5; 6, Sox6; w, wild type; h, heterozygous null; n, homozygous null. (A) Alcian blue staining of E14.5 embryos. Top and bottom embryos are from different litters. Arrows, Meckel's cartilages; arrowhead, bent radius and ulna. (B) Skeletal preparations of vertebrae from E17.5 littermates. Alcian blue stains nonmineralized cartilage and alizarin red stains mineralized cartilage and bone. (Arrows) L1 and L6, first and sixth lumbar vertebrae, respectively. (C) Pictures of newborns. The first two and the last two mice are from separate litters. Arrows, bent hindlimbs. (D–G) Skeletal preparations of newborn littermates. (D) Forelimbs. Arrowheads, bent humeri and radii. (E) Cervical vertebrae. Arrows, vertebral bodies. (F) Lumbar and sacral vertebrae. L6, sixth lumbar vertebra; S1, first sacral vertebra. Arrows, vertebral bodies and arches separated by nonmineralized cartilage in controls and mineralized cartilage or bone in mutants. (G) Sternum. Arrows, intersternebrae made of nonmineralized cartilage in the control and mineralized bone or cartilage in the mutants.
Figure 2.
Figure 2.
Premature prehypertrophy of 3NA and 4NA chondroblasts. Longitudinal sections through the tibias (A), humeri (B and D), or sternums (C) of E13.5 to E16.5 control and mutant embryos were stained with Alcian blue or hybridized in situ with RNA probes, as indicated. White bars, prehypertrophic chondrocyte domains. Sternum prehypertrophic chondrocytes are recognized by a white cytoplasm. Arrows, sternebrae. For E14.5 humeri, the control proximal half and the entire mutant element are shown.
Figure 3.
Figure 3.
Delayed hypertrophy and terminal differentiation of 3NA chondrocytes. (A and C) Longitudinal sections through the shaft of control and 3NA humeri from E14.5 and E15.0 littermates stained with Alcian blue (top) or the von Kossa reagent (bottom). The von Kossa reaction identifies mineral deposits (black signal). (insets) High-magnification pictures showing the size of chondrocytes in the core region at E14.5 and in the flanking region at E15.0 (Alcian blue), and the extent of cartilage mineralization next to the bone collar (von Kossa). (B and D) Sections adjacent to those shown in A and C hybridized in situ with RNA probes, as indicated. The hybridization signal for Col10a1 is so strong in the E14.5 control hypertrophic zone that it appears black. P, prehypertrophic zone; H, hypertrophic zone; T, terminal zone; B, primary ossification center.
Figure 4.
Figure 4.
Defective growth plates in 3NA humeri. (A) Longitudinal sections in control and 3NA E15.5 humeri stained with Alcian blue. Four histological regions are recognized: E, epiphysis; C, columnar region; H, hypertrophic region; B, primary ossification center. (B) Relative growth of the histological regions in control and 3NA humerus proximal halves from E13.5 to birth (P0). Pictures of humerus sections were taken at identical magnification for all samples. The distance between the middle of the humerus and the proximal limit of each region was measured for two to four different mice per genotype and per age. The averages of these distances were calculated per mouse category and are presented relative to the length of the proximal half of newborn control humeri, which was assigned a value of 100. The curves connect the values measured for each region (indicated underneath the curves) from E13.5 or E15.5 to birth. (C) Longitudinal sections of control and 3NA humerus heads stained with Alcian blue. Brackets show the epiphysis (E), columnar (C), and hypertrophic (H) regions. Bottom left, high magnification pictures of cells in these regions. The table indicates the number of cell layers in each region for one representative embryo pair as the average with SD of measurements made in three nonconsecutive sections.
Figure 5.
Figure 5.
Slow proliferation of 3NA chondroblasts. (A and B) BrdU labeling and cell proliferation rates in control and 3NA humeri in E13.5 and E16.5 embryos. Pictures show longitudinal sections of humeri stained for BrdU (brown nuclei). The percentages of BrdU-positive chondroblasts were determined in the consecutive segments delineated with black lines and plotted in the graphs. The arrows in the graph indicate that the cells enlarging the distal half of epiphyses and elongating humeri shafts primarily arise from cells proliferating maximally at the top of metaphyses, and that cells in the proximal half of E16.5 epiphyses arise from cells highly proliferating in periarticular regions. Ep, epiphysis; M, metaphysis; Ce, center; Col, columnar zone.
Figure 6.
Figure 6.
Reduced hypertrophic zone in 3NA growth plates. (A) Longitudinal sections through humeri of control and 3NA newborn mice. Consecutive sections were stained with Alcian blue or the von Kossa reagent, or hybridized with RNA probes, as indicated. Pictures focus on the lower part of growth plates and are aligned at the level of the ossification front. The von Kossa pictures show the last cell layers of the growth plates at high magnification. White arrows, expression domains of tested genes. Green arrows, cell layers between the gene expression domain and the ossification front. Blue arrows, layers of matrix-mineralizing chondrocytes. (B) Longitudinal sections through humeri of control and 4NA E15.5 fetuses. Consecutive sections were stained with Alcian blue or the von Kossa reagent, or hybridized with RNA probes, as indicated. Control pictures show the proximal growth plate of the humerus and mutant pictures show the entire humerus. The von Kossa pictures were taken at higher magnification.
Figure 7.
Figure 7.
Vertebrae and sternum of 3NA newborns. (A) Transverse sections of lumbar vertebrae. The top section for each genotype was stained with Alcian blue and the bottom section with the von Kossa reagent. (insets) High magnification pictures of hypertrophic chondrocytes. NA, neural arch ossification center; GP, bidirectional growth plate; VB, vertebral body ossification center. (B) Mid-sagittal sections of the sternum. The mouse ventral side is at the bottom of the pictures. The top section for each genotype was stained with Alcian blue and the bottom with the von Kossa reagent. All sections were from different mice. Red arrows, intersternebrae. bc, bone collar; p, perichondrium/periosteum. Black boxes, regions of the sternums shown in C. (C) RNA in situ hybridization of sternum mid-sagittal sections consecutive to those stained with Alcian blue in B.
Figure 8.
Figure 8.
Expression of regulatory genes in 3NA growth plates. Longitudinal sections through humeri of control and 3NA embryos were hybridized at different ages with RNA probes for Runx2 (A), Pthrp (B), Ihh (C), Ptc1 (D), Fgfr3 (E), and Bmp6 (F), as indicated. Arrows, Ihh expression domain and positive gradient of Fgfr3 expression in the columnar zone.
Figure 9.
Figure 9.
Proposed model for the roles of Sox5 and Sox6 in chondrocytes. Sox5 and Sox6 are expressed in prechondrocytes, chondroblasts, and early prehypertrophic chondrocytes such that their mode of action at these stages must be direct or indirect (green and red solid lines). They are no longer expressed in late prehypertrophic, hypertrophic, and terminal chondrocytes, and therefore their mode of action at these stages must be indirect (red and green dashed lines). Sox5 and Sox6 act to promote (green arrows) the differentiation of prechondrocytes into early chondroblasts and the subsequent differentiation of early chondroblasts into epiphyseal, source, or columnar chondroblasts. Sox5 and Sox6 also stimulate proliferation of all chondroblasts (curved arrows indicate cell proliferation and their thickness reflects proliferation rates). Sox5 and Sox6 maintain columnar chondroblasts proliferating and delay (red bars) prehypertrophic differentiation of early and columnar chondroblasts at least in part by delaying Fgfr3 up-regulation and by down-regulating Runx2. Finally, Sox5 and Sox6 are needed to allow induction of chondrocyte hypertrophy and to delay terminal differentiation of prehypertrophic and hypertrophic chondrocytes induced by ossification fronts.

Similar articles

Cited by

References

    1. Abad, V., J.L. Meyers, M. Weise, R.I. Gafni, K.M. Barnes, O. Nilsson, J.D. Bacher, and J. Baron. 2002. The role of the resting zone in growth plate chondrogenesis. Endocrinology. 143:1851–1857. - PubMed
    1. Akiyama, H., M.C. Chaboissier, J.E. Martin, A. Schedl, and B. de Crombrugghe. 2002. The transcription factor Sox9 has essential roles in successive steps of the chondrocyte differentiation pathway and is required for expression of Sox5 and Sox6. Genes Dev. 16:2813–2828. - PMC - PubMed
    1. Baur, S.T., J.J. Mai, and S.M. Dymecki. 2000. Combinatorial signaling through BMP receptor IB and GDF5: shaping of the distal mouse limb and the genetics of distal limb diversity. Development. 127:605–619. - PubMed
    1. Bi, W., J.M. Deng, Z. Zhang, R.R. Behringer, and B. de Crombrugghe. 1999. Sox9 is required for cartilage formation. Nat. Genet. 22:85–89. - PubMed
    1. Bi, W., W. Huang, D.J. Whitworth, J.M. Deng, Z. Zhang, R.R. Behringer, and B. de Crombrugghe. 2001. Haploinsufficiency of Sox9 results in defective cartilage primordia and premature skeletal mineralization. Proc. Natl. Acad. Sci. USA. 98:6698–6703. - PMC - PubMed

Publication types

MeSH terms

Substances