. 2004 Mar;24(6):2423-43.
doi: 10.1128/MCB.24.6.2423-2443.2004.

A novel retinoic acid-responsive element regulates retinoic acid-induced BLR1 expression

Affiliations

A novel retinoic acid-responsive element regulates retinoic acid-induced BLR1 expression

Jianrong Wang et al. Mol Cell Biol. 2004 Mar.

Abstract

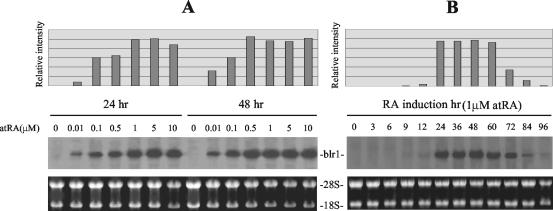
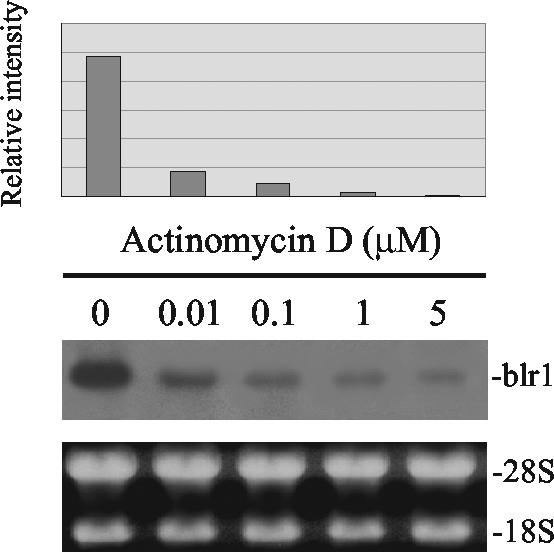
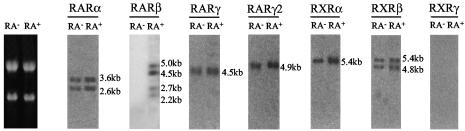
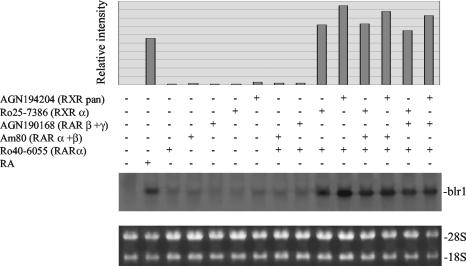
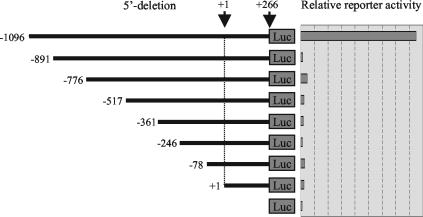
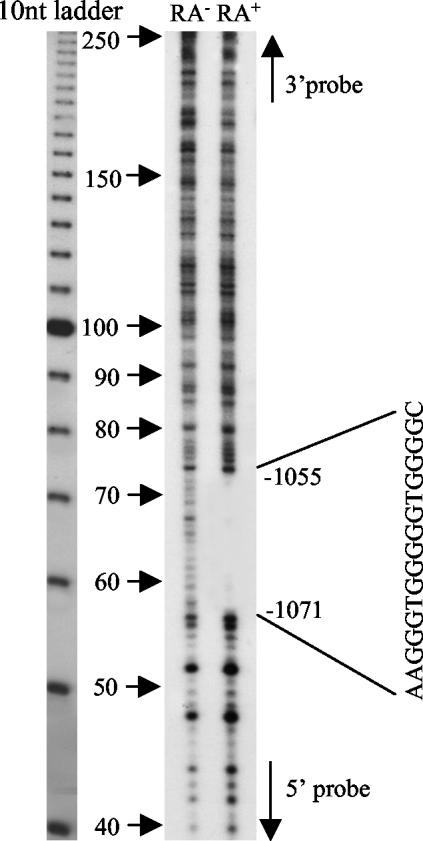
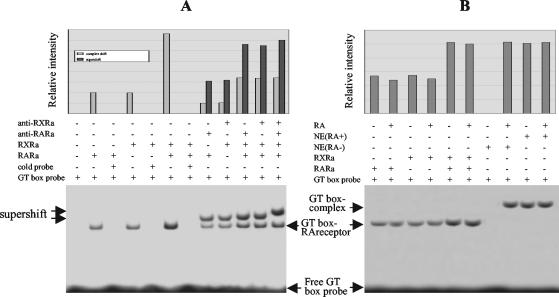
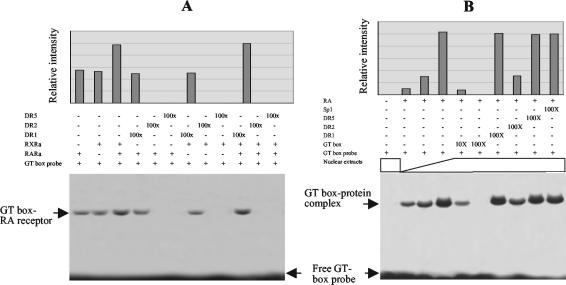
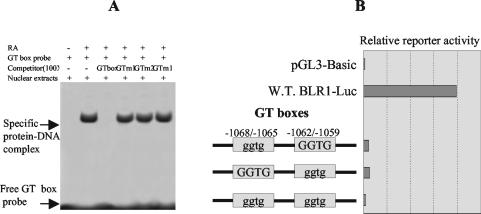
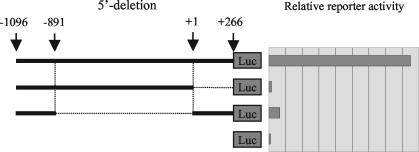
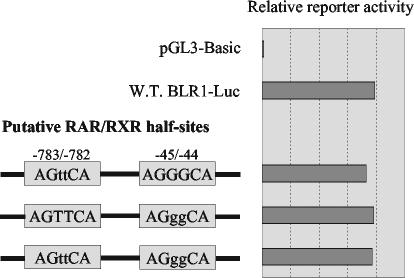
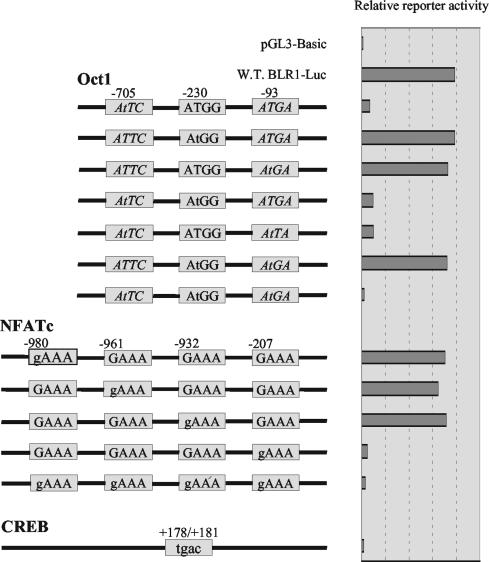
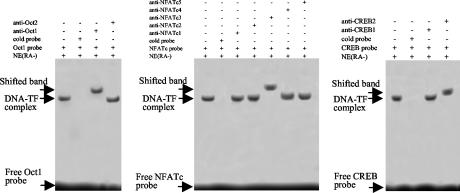
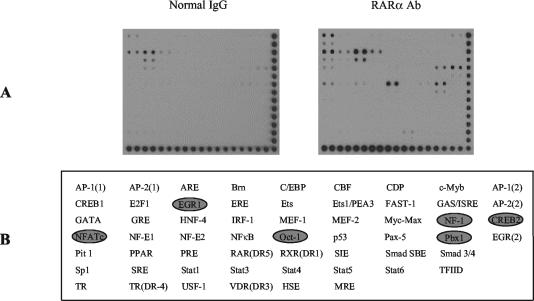
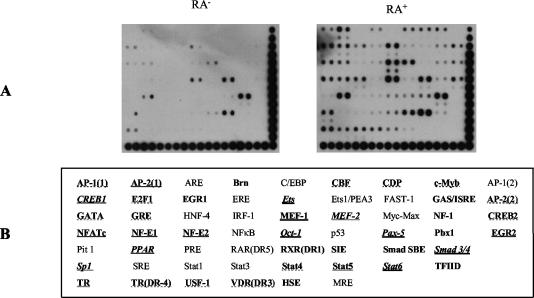
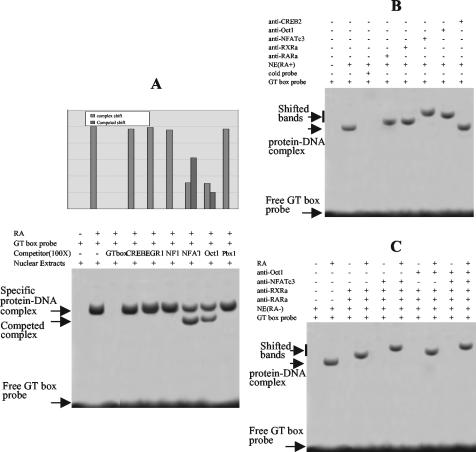
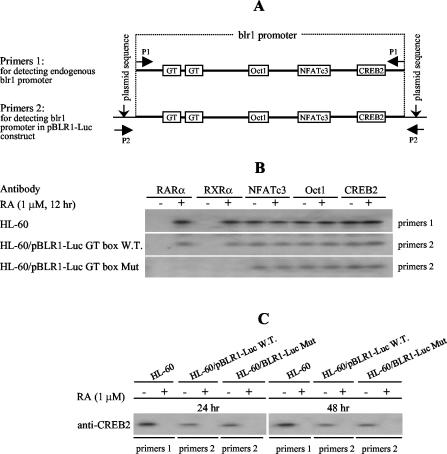
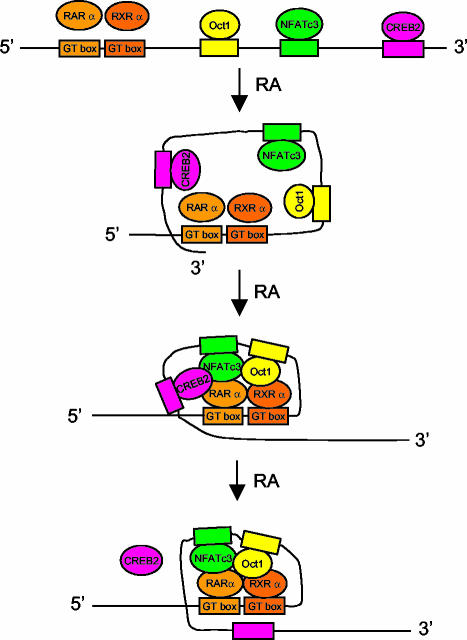
The mechanism of action of retinoic acid (RA) is of broad relevance to cell and developmental biology, nutrition, and cancer chemotherapy. RA is known to induce expression of the Burkitt's lymphoma receptor 1 (BLR1) gene which propels RA-induced cell cycle arrest and differentiation of HL-60 human myeloblastic leukemia cells, motivating the present analysis of transcriptional regulation of blr1 expression by RA. The RA-treated HL-60 cells used here expressed all RA receptor (RAR) and retinoid X receptor (RXR) subtypes (as detected by Northern analysis) except RXRgamma. Treatment with RAR- and RXR-selective ligands showed that RARalpha synergized with RXRalpha to transcriptionally activate blr1 expression. A 5'-flanking region capable of supporting RA-induced blr1 activation in HL-60 cells was found to contain a 205-bp sequence in the distal portion that was necessary for transcriptional activation by RA. Within this sequence DNase I footprinting revealed that RA induced binding of a nuclear protein complex to an element containing two GT boxes. Electromobility shift assays (EMSAs) and supershift assays showed that this element bound recombinant RARalpha and RXRalpha. Without RA there was neither complex binding nor transcriptional activation. Both GT boxes were needed for binding the complex, and mutation of either GT box caused the loss of transcriptional activation by RA. The ability of this cis-acting RAR-RXR binding element to activate transcription in response to RA also depended on downstream sequences where an octamer transcription factor 1 (Oct1) site and a nuclear factor of activated T cells (NFATc) site between this element and the transcriptional start, as well as a cyclic AMP response element binding factor (CREB) site between the transcriptional start and first exon of the blr1 gene, were necessary. Each of these sites bound its corresponding transcription factor. A transcription factor-transcription factor binding array analysis of nuclear lysate from RA-treated cells indicated several prominent RARalpha binding partners; among these, Oct1, NFATc3, and CREB2 were identified by competition EMSA and supershift and chromatin immunoprecipitation assays as components of the complex. RA upregulated expression of these three factors. In sum the results of the present study indicate that RA-induced expression of blr1 expression depends on a novel RA response element. This cis-acting element approximately 1 kb upstream of the transcriptional start consists of two GT boxes that bind RAR and RXR in a nuclear protein complex that also contains Oct1, NFATc3, and CREB2 bound to their cognate downstream consensus binding sites.


Figures

FIG. 1.
FIG. 1.
Effect of all-trans-RA on BLR1 mRNA expression. Total RNA isolated from HL-60 cells treated with RA was analyzed by Northern blotting (middle panels) using a blr1 cDNA-specific probe. Ethidium bromide-stained 28S and 18S rRNA bands are shown (lower panels) to indicate the uniformity of RNA loading per lane. The upper charts show the relative Northern blot band intensities (as measured by a PhosphorImager). The values were normalized using 18S rRNA band intensity. (A) Effect of all-trans-RA concentration on blr1 mRNA expression. HL-60 cells were treated for 24 or 48 h with the indicated concentrations of RA. The highest blr1 mRNA expression levels observed were in cells treated with 1 to 10 μM RA for 24 h and 0.5 to 10 μM RA for 48 h. (B) Time course of RA-induced blr1 mRNA expression. HL-60 cells were treated with 1 μM RA for the indicated times. The maximum increase in blr1 mRNA expression occurred at 24 to 60 h.
FIG. 2.
FIG. 2.
Inhibition of RA-induced BLR1 mRNA expression by actinomycin D. HL-60 cells were treated with the indicated concentrations of actinomycin D for 24 h following pretreatment with 1 μM all-trans-RA for 24 h. (Middle panel) Total RNA isolated from the treated cells was analyzed by Northern blotting using a blr1 cDNA-specific probe. (Lower panel) Ethidium bromide-stained 28S and 18S rRNA bands are shown to demonstrate uniform loading of RNA per lane. (Upper panel) The chart shows the relative intensities of Northern blot bands (as measured with a PhosphorImager). The values were normalized using 18S rRNA band intensity.
FIG. 3.
FIG. 3.
Expression of RARs and RXRs in HL-60 cells. Total RNA (isolated from HL-60 cells that were left untreated [RA] or treated with 1 μM RA for 48 h [RA+]) was analyzed by Northern blotting. RAR and RXR subtype-specific primers located in the 3′ ends of their corresponding cDNAs were used so that for each receptor subtype, all possible isoforms derived from alternative in-frame translational start codons would be detected. Except for the primer for RXRγ (which was amplified from a plasmid), all other specific primers were prepared by RT-PCR from HL-60 cells. The probes were [α-32P]dCTP labeled. Ethidium bromide-stained 28S and 18S rRNA bands are shown to serve as size markers. Constitutively expressed transcripts of RARα, RARγ, RARγ2, RXRα, and RXRβ were observed. RARα and RXRβ showed two isoforms. RARβ (detected only after RA treatment) showed four isoforms. RXRγ was not detectable in untreated or RA-treated cells.
FIG. 4.
FIG. 4.
Effect of RAR- and RXR-selective agonists on BLR1 mRNA. HL-60 cells were treated with the indicated retinoid ligands for 48 h, after which total cellular RNA was isolated and analyzed by Northern blotting using a blr1 cDNA-specific probe (middle panel). Ethidium bromide-stained 28S and 18S rRNA bands are shown to indicate the uniformity of RNA loading per lane (lower panel). The concentrations of the compounds used are as follows: RA, 1 μM; Ro 40-6055 (RARα-selective agonist), 1 μM; AM80 (RARα- and RARβ-selective agonist), 0.5 μM; AGN190168 (RARβ- and RARβγ-selective agonist), 0.5 μM; Ro25-7386 (RXRα-selective agonist), 1 μM; AGN194204 (RXR panagonist), 0.3 μM. The upper chart shows the relative intensities of bands on the Northern blot (as measured by a PhosphorImager). The values were normalized using 18S rRNA band intensity.
FIG. 5.
FIG. 5.
Mapping of the RA-regulatory elements in the BLR1 promoter. Reporter constructs resulting from 5′ deletions from the 1,360 bp of the BLR1 5′-flanking region were prepared by PCR and transiently transfected into HL-60 cells as described in Materials and Methods. The lines and numbers on the left side of the figure indicate the blr1 promoter sequence contained in each reporter construct (+1 denotes the start of transcription). The chart on the right side indicates relative luciferase activity levels of the reporter constructs. All transient transfection studies were conducted in triplicate on three separate occasions, with similar results. The data reported in the chart represent the means of three replicate experiments.
FIG. 6.
FIG. 6.
RA-induced nuclear extracts protect sequences in the distal region of the BLR1 promoter. A dsDNA fragment of 250 bp (spanning 217 bp [−1096 to −879] in the BLR1 promoter plus 25 bp at the 5′ end from the plasmid backbone sequence in the pBLR1-Luc promoter-reporter construct and 8 nt from the incorporated EcoRI and PstI site) was prepared by PCR. After digestion with EcoRI and PstI, the amplified fragment was [α-32P]dATP and [α-32P]dTTP end labeled at the 3′ recessed end with the Klenow fragment of Escherichia coli DNA polymerase I and used in the DNase I footprinting assay with nuclear extracts from HL-60 cells that were either left untreated (RA) or treated (RA+) with all-trans-RA for 48 h. A DNA sequencing ladder (10 bp) was end labeled (using T4 polynucleotide kinase) with [γ-32P]ATP, heat denatured, and corun with the DNase I-treated samples as a size marker. The nucleotide sequence of the DNase I-protected site was determined by alignment of the protected region with the sequencing ladder. An approximately 17-bp region (−1071 to −1055) with the indicated sequence was specifically protected from DNase I digestion in the nuclear extracts from RA-treated cells. No footprint was visible with nuclear extracts from untreated cells. An autoradiograph of the DNA footprint is shown. The sizes of the denatured DNA sequence markers that were corun with the samples are indicated with arrows on the left side of the right panel. The 5′ and 3′ ends of the DNA probe used in the footprinting assay are indicated by arrows pointing up and down. The nucleotide sequence of the DNA footprint is shown on the right. Numbers indicate the positions of start and end points of the protection region relative to +1, the transcriptional initiation site.
FIG. 7.
FIG. 7.
Retinoid receptors specifically bind to the GT box element in the blr1 promoter. Electrophoretic mobility shift assays were conducted using the in vitro translation products of RARα and RXRα or nuclear extracts of HL-60 cells with (+) or without (−) 1 μM RA treatment and the GT box element (identified in the blr1 promoter as a biotin-labeled double-stranded oligonucleotide probe as described under Materials and Methods). DNA on the membrane was visualized and quantified on a PhosphorImager. The upper charts indicate the relative binding affinities of the DNA-protein complex and supershifted complex. (A) Lane 1 (first lane from the left), free biotin-labeled GT box element probe; lanes 2, 3, and 8, RARα-incubated probe; lanes 4, 5, and 9, RXRα-incubated probe; lanes 6, 10, 11, and 12, RARα- and RXRα-coincubated probe; lanes 3, 5, and 7, probe in the presence of a 100-fold excess of unlabeled GT box competitor; lanes 8 and 10, probe in the presence of RARα antibody; lane 9 and 11, probe in the presence of RXRα antibody; lane 12, probe in the presence of anti-RARα IgG and anti-RXRα IgG. (B) Lanes 1, 3, and 5, GT box probe and in vitro-translated RAR without RA; lanes 2, 4, and 6, GT box probe and in vitro-translated RAR incubated with 1 μM RA for 24 h at 37°C; lane 7, GT box probe and nuclear extracts from non-RA-treated HL-60 cells incubated without RA; lane 8, GT box probe and nuclear extracts from non-RA-treated HL-60 cells incubated with 1 μM RA for 24 h at 37°C; lanes 9 and 10, GT box probe and nuclear extracts from RA-treated HL-60 cells incubated without or with 1 μM RA for 24 h at 37°C.
FIG. 8.
FIG. 8.
DR2 oligonucleotides compete with the GT box element for binding nuclear proteins of RA-treated (+) HL-60 cells. EMSAs with competing test oligonucleotides were performed using in vitro-translated RARs and nuclear extracts from untreated (−) and all-trans-RA (1 μM)-treated HL-60 cells. The probe was the wild-type GT box element. The numbers above the blots (lower panels) indicate the severalfold excesses of the competing oligonucleotides added. The arrows indicate the specific GT box element-nuclear protein binding complex (upper part of the gel) and the free GT box probe (bottom of the gel). The upper chart indicates the relative binding levels of the DNA-protein complex. (A) Lanes 1, 2, and 3 (lane 1 is the first lane from the left), GT box probe and in vitro-translated RARα and RXRα receptors; lanes 4, 7, and 10, GT box probe and in vitro-translated RARs incubated with DR1; lanes 5, 8, and 11, GT box probe and in vitro-translated RARs incubated with DR2; lanes 6, 9, and 12, GT box probe and in vitro-translated RARs incubated with DR5. The EMSAs with in vitro-translated RARs were repeated, and the same results were obtained. (B) GT box probe was incubated with nuclear extracts from 48-h RA (1 μM)-treated HL-60 cells (lanes 1 and 5 to 10, 80 μg each; lanes 2, 3, and 4, respectively, 5, 20, and 80 μg). Unlabeled synthetic oligonucleotides for typical RAR binding DR5, DR2, and DR1 sequences, as well as the Sp1 DNA binding consensus sequence, were used as competitors for GT box element binding. The assays repeated using nuclear extracts from cells treated with 1 μM RA for 24 h yielded similar results.
FIG. 9.
FIG. 9.
Mutation of the GT box element diminishes binding of the RA-induced complex to the sequence motif and abolishes activation of the blr1 promoter following RA induction. (A) EMSAs were done with nuclear extracts of HL-60 cells with (+) or without (−) RA treatment and the biotin-labeled 17-nt wild-type GT box element (GTbox) from the blr1 promoter and its mutants with either or both GT boxes deleted (13-bp fragment, GTm1 and Gtm2; 9-bp fragment, GTm12). Binding was detected with wild-type GT boxes; this binding was not detected with either of the GT boxes mutated. The EMSA was repeated, and the same result was achieved. (B) Mutation of GT boxes within the wild-type (W.T.) GT box element used in the BLR1-Luc promoter reporter construct was performed using PCR with three pairs of primers as described in Materials and Methods. The BLR1-Luc reporter constructs containing the indicated mutations in either one or both of the GT boxes were cotransfected with pRL-TK into HL-60 cells. Cells were collected after 48 h for assaying luciferase levels. The chart at the right represents the activity of the BLR1-Luc reporters relative to that of the promoterless reporter control. The transient transfection with the mutated constructs was repeated twice with similar results.
FIG. 10.
FIG. 10.
RA responsiveness by the GT box element RARE depends on the downstream context in the blr1 promoter. Promoter-reporter constructs from which 5′ sequences of −891 to +1 or +1 to +266 in the 1,360 bp of the BLR1 5′-flanking region were deleted were prepared by PCR and transiently transfected into HL-60 cells which were then treated with all-trans-RA for 48 h and assayed for luciferase activity as described in Materials and Methods. The lines and numbers indicate the blr1 promoter sequence contained in each promoter-reporter construct. The chart on the right side indicates the relative luciferase activity level for each promoter-reporter construct. With the loss of either segment, the distal sequence from −1096 to −891 containing the GT box element was no longer able to confer responsiveness to all-trans-RA. All transient transfection studies were conducted in triplicate on three separate occasions with similar results. The chart reports the means of three experiments.
FIG. 11.
FIG. 11.
The putative RAR-RXR half-sites identified by TransFac database analysis do not control blr1 response to RA. Mutations within either or both of two putative RAR-RXR half-sites at −783 to −782 and −45 to −44 in the blr1 promoter identified by TransFac database analysis were created in the BLR1-Luc construct with two pairs of primers specific to these putative sites as described in Materials and Methods. The wild-type (W.T.) BLR1-Luc reporter and its mutants were cotransfected with pRL-TK into HL-60 cells. The cells were treated with 1 μM all-trans-RA for 48 h and harvested to assay luciferase activity. The values represent the activity of the BLR1-Luc reporters relative to that of the promoterless reporter control. Transient transfections with these mutated constructs were repeated twice, and the same results were obtained.
FIG. 12.
FIG. 12.
Mutation of Oct1, NFATc, or CREB motifs downstream of the GT box element abolishes RA inducibility of the BLR1 promoter. Deletion mutagenesis targeting the three Oct1, four NFATc, and one CREB consensus sequences in the blr1 promoter was performed on the BLR1-Luc construct as described in Materials and Methods. Bases in lowercase are deleted. The consensus sequence (ATTC) in italics is located in the antisense strand of DNA. The BLR1-Luc reporter constructs containing the indicated mutations were cotransfected with pRL-TK into HL-60 cells, which were treated for 48 h with all-trans-RA and then collected to assay luciferase activity levels. The values represent the activity of the BLR1-Luc reporters relative to that of the promoterless reporter control. Transient transfections with the mutated constructs were repeated twice, and the same results were obtained.
FIG. 13.
FIG. 13.
Oct1, NFATc3, and CREB2 bind to their corresponding consensus sites in the blr1 promoter. EMSAs were performed to confirm that the Oct1, NFATc, and CREB sites identified in the blr1 promoter by TransFac database analysis and functional mutagenesis experiments are actual consensus binding sites for these factors. The oligonucleotide sequences harboring the database-deduced binding sites (Oct1, TGAATAAAAAATTG [−707 to −694]; NFATc, GTGAGGAAAATG [−212 to −201]; CREB, GAGCTGACGGCT [+174 to +185]) were synthesized and used as probes. Nuclear extracts (NE) from non-RA-treated HL-60 cells were incubated with the biotin-labeled probe. Antibodies specific to the individual factors were added to induce supershifts. Supershifts were observed with anti-Oct1 (left panel), anti-NFATc3 (center panel), and anti-CREB2 (right panel), suggesting that Oct1, NFATc3, and CREB2 bind their putative consensus binding sites in the blr1 promoter.
FIG. 14.
FIG. 14.
TF-TF array for detecting TFs binding to RARα. Array analysis of TFs binding to RARα in RA-induced HL-60 cells was carried out using a Panomics TransSignal TF-TF array system as described in Materials and Methods. The organization of the TF-TF array was identical to the that of the TransSignal DNA-protein array described for Fig. 15. (A) The right panel shows hybridization signals of TFs binding to RARα using anti-RARα, and the left panel shows the results obtained using normal IgG with a control. (B) The table shows the identities of TFs in the array that bind to RARα after treatment of HL-60 cells with 1 μM all-trans-RA for 12 h. The most prominent RARα binding TFs detected in the array are circled.
FIG. 15.
FIG. 15.
Protein-DNA array analysis for detecting RA-inducible TFs in HL-60 cells. DNA-protein array analysis was carried out using a Panomics TransSignal DNA-protein array system as described in Materials and Methods. The results of array hybridizations in which nuclear extracts of HL-60 cells that were left untreated (48-h control) or treated with 1 μM all-trans-RA for 48 h were analyzed are shown. Experiments repeated using the nuclear extracts prepared after 12, 24, and 48 h of all-trans-RA treatment all gave the same results. Each TF was represented in four spots on the blot in a two-by-two grouping of two rows and two columns. The first row consisted of DNA spotted normally, and the second row consisted of DNA diluted 1:10. (A) The panels show the resulting hybridization signals of TFs in cells with (right panel) or without (left panel) all-trans-RA induction. (B) The table shows the TFs represented in the array and identifies those with strong hybridization signals induced by the presence of all-trans-RA in HL-60 cells. Roman lightface letters indicate no induced expression; roman boldface letters without underlining indicate low-level induced expression; roman boldface letters with dotted underlining indicate medium-level induced expression; roman boldface letters with regular underlining indicate high-level induced expression; boldface letters with thick underlining indicate very-high-level induced expression; boldface italic letters with underlining indicate expression at lower levels before induction and at higher levels after all-trans-RA induction.
FIG. 16.
FIG. 16.
RA induces formation of a multimolecular complex that includes RARα, RXRα, Oct1, and NFATc3 and binds the GT box element in the blr1 promoter. (A) (Lower panel) EMSAs with competing test oligonucleotides were performed using the 17-bp GT box element labeled with biotin as the probe of nuclear extracts from HL-60 cells that were left untreated (−) or treated with 1 μM all-trans-RA for 48 h (+). A total of 100-fold of each unlabeled GT box element (lane 3 [lane 1 is the first lane from the left]), CREB (lane 4), EGR1 (lane 5), NF1 (lane 6), NFATc (lane 7), Oct1 (lane 8), and Pbx1 (lane 9) oligonucleotide was added as a competitor for their cognate factors' possible binding to the GT box element DNA-protein complex. The arrows indicate the specific DNA-protein complex (upper part of the gel) and the free GT box probe (bottom part of the gel). The assay was repeated three times using different preparations of nuclear extracts of HL-60 cells with 24- and 48-h all-trans-RA treatment. All replicates yielded similar results. (Upper panel) The chart indicates relative binding levels of the DNA-protein complex with the GT box element or targeted competitor oligonucleotides. (B) EMSAs were performed using antibodies specific to RARα, RXRα, Oct1, NFATc3, and CREB2 added to the incubation reactions of GT box probe and nuclear extracts (NE) of 48-h RA (1 μM)-treated HL-60 cells. Supershifts were observed with antibodies for RARα, RXRα, Oct1, and NFATc3 but not CREB2, suggesting that RARα, RXRα, Oct1, and NFATc3 are included in the complex induced by 48-h RA treatment. (C) EMSAs were performed with the GT box sequence probe and nuclear extracts from untreated cells in the absence or presence of RA in the binding reaction to test the dependence of binding on RA. Nuclear extracts from non-RA-treated HL-60 cells showed no GT box-bound complexes regardless of the presence or absence of added antibodies. Nuclear extracts from cells with RA added showed the GT box-bound complex which was supershifted by the addition of antibodies specific to the components of the complex. GT box probe and nuclear extracts from non-RA-treated HL-60 cells incubated with 1 μM all-trans-RA for 24 h (shown) or 48 h yielded the same pattern of protein-DNA interaction. RA thus induces formation of a multiprotein complex binding to the GT box sequence.
FIG. 17.
FIG. 17.
Physical interaction of RARα, RXRα, Oct1, NFATc3, and CREB2 with the blr1 promoter. ChIP assays were conducted to assess the interaction of RARα, RXRα, Oct1, NFATc3, and CREB2 with the blr1 promoter in intact HL-60 cells. HL-60 cells and HL-60 cells transfected with GT box wild-type (W.T.) or mutant constructs were treated with (+) or without (−) 1 μM all-trans-RA for 12, 24, and 48 h. The cells were cross-linked with formaldehyde. Chromatin- and TF-bound transfected plasmids were immunoprecipitated with antibodies to RARα, RXRα, Oct1, NFATc3, or CREB2. After reversing the cross-link, DNA released from the immunoprecipitates was used for radioactive PCR analysis by two different pairs of primers (detecting the endogenous or transfected promoter). Specific bands representing the promoter sequence were detected by resolving the PCR products on PAGE. (A) The positions of the two sets of primers used for detecting the blr1 promoter sequence are shown. (B) ChIP assays using 12-h all-trans-RA-treated or untreated cells were conducted with antibody specific to RARα, RXRα, Oct1, NFATc3, or CREB2. (C) Anti-CREB2 ChIP assays using 24- and 48-h all-trans-RA-treated or untreated cells.
FIG. 18.
FIG. 18.
An illustration of the model for blr1 transcription activation by RA through a novel RARE. Without RA, RARs at in vivo levels are unable to bind the GT box motif whereas Oct1, NFATc3, and CREB2 bind their corresponding consensus binding sites in the blr1 promoter in a RA-independent manner. Treatment with RA causes a nuclear protein complex containing TFs RARα, RXRα, Oct1, and NFATc3 to form at a novel GT box RARE. CREB2 may be involved transiently in the complex at an early stage of activation. RA thus causes the DNA-tethered Oct1, NFATc3, and CREB2 to associate with the RARα-RXRα which binds to the novel GT box RARE to finally activate transcription of blr1 gene in HL-60 cells.

Similar articles

Cited by

References

    1. Altucci, L., A. Rossin, W. Raffelsberger, A. Reitmair, C. Chomienne, and H. Gronemeyer. 2001. Retinoic acid-induced apoptosis in leukemia cells is mediated by paracrine action of tumor-selective death ligand TRAIL. Nat. Med. 7:680-686. - PubMed
    1. Anderson, K. L., K. A. Smith, K. Conners, S. R. McKercher, R. Maki, and B. E. Torbett. 1998. Myeloid development is selectively disrupted in PU. 1 null mice. Blood 91:3702-3710. - PubMed
    1. Babina, M., K. Mammeri, and B. M. Henz. 2001. Retinoic acid up-regulates myeloid ICAM-3 expression and function in a cell-specific fashion—evidence for retinoid signaling pathways in the mast cell lineage. J. Leukoc. Biol. 69:361-371. - PubMed
    1. Barella, L., M. Loetscher, A. Tobler, M. Baggiolini, and B. Moser. 1995. Sequence variation of a novel heptahelical leucocyte receptor through alternative transcript formation. Biochem. J. 309:773-779. - PMC - PubMed
    1. Battle, T. E., and A. Yen. 2002. Ectopic expression of CXCR5/BLR1 accelerates retinoic acid- and vitamin D3-induced monocytic differentiation of U937 cells. Exp. Biol. Med. 227:753-762. - PubMed

Publication types

MeSH terms

LinkOut - more resources