. 2004 Mar;24(6):2478-86.
doi: 10.1128/MCB.24.6.2478-2486.2004.

Histone H3-K9 methyltransferase ESET is essential for early development

Affiliations

Histone H3-K9 methyltransferase ESET is essential for early development

Jonathan E Dodge et al. Mol Cell Biol. 2004 Mar.

Abstract

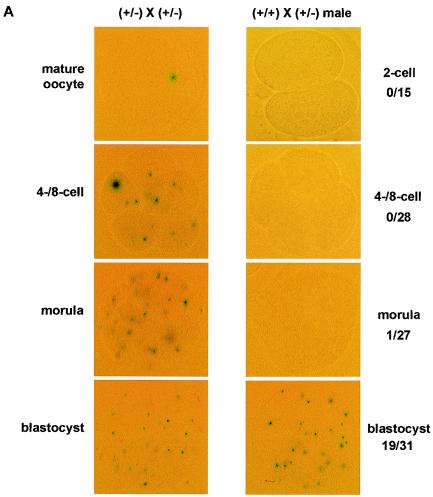
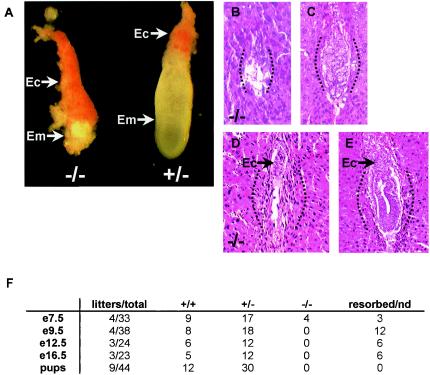
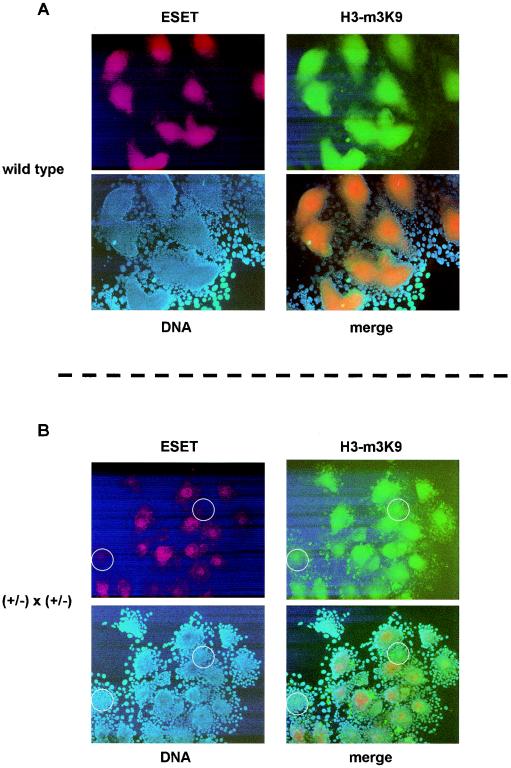
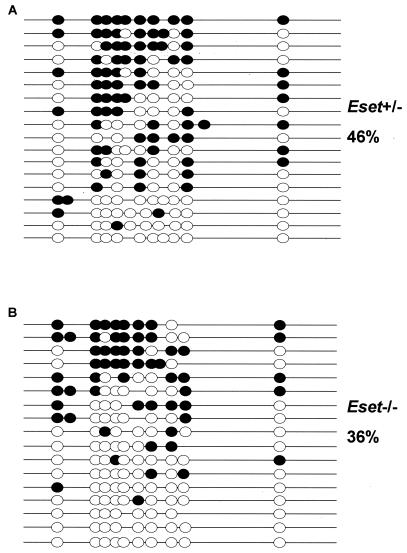
Methylation of histone H3 at lysine 9 (H3-K9) mediates heterochromatin formation by forming a binding site for HP1 and also participates in silencing gene expression at euchromatic sites. ESET, G9a, SUV39-h1, SUV39-h2, and Eu-HMTase are histone methyltransferases that catalyze H3-K9 methylation in mammalian cells. Previous studies demonstrate that the SUV39-h proteins are preferentially targeted to the pericentric heterochromatin, and mice lacking both Suv39-h genes show cytogenetic abnormalities and an increased incidence of lymphoma. G9a methylates H3-K9 in euchromatin, and G9a null embryos die at 8.5 days postcoitum (dpc). G9a null embryo stem (ES) cells show altered DNA methylation in the Prader-Willi imprinted region and ectopic expression of the Mage genes. So far, an Eu-HMTase mouse knockout has not been reported. ESET catalyzes methylation of H3-K9 and localizes mainly in euchromatin. To investigate the in vivo function of Eset, we have generated an allele that lacks the entire pre- and post-SET domains and that expresses lacZ under the endogenous regulation of the Eset gene. We found that zygotic Eset expression begins at the blastocyst stage and is ubiquitous during postimplantation mouse development, while the maternal Eset transcripts are present in oocytes and persist throughout preimplantation development. The homozygous mutations of Eset resulted in peri-implantation lethality between 3.5 and 5.5 dpc. Blastocysts null for Eset were recovered but in less than Mendelian ratios. Upon culturing, 18 of 24 Eset(-/-) blastocysts showed defective growth of the inner cell mass and, in contrast to the approximately 65% recovery of wild-type and Eset(+/-) ES cells, no Eset(-/-) ES cell lines were obtained. Global H3-K9 trimethylation and DNA methylation at IAP repeats in Eset(-/-) blastocyst outgrowths were not dramatically altered. Together, these results suggest that Eset is required for peri-implantation development and the survival of ES cells.


Figures

FIG. 1.
FIG. 1.
Generation of a null Eset allele in the mouse. (A) Schematic representation of the genomic structure of Eset (top), followed by the targeting vector and finally the targeted Eset locus. Deletion of exons 15 to 22 removed the entire pre- and post-SET domains, which, based on biochemical studies, eliminates all H3-K9 catalytic activity. MBD, methyl-CpG binding domain. (B) Southern blot analysis of EcoRI-digested genomic DNA probed with a 500-bp 3′ probe external to the targeting vector confirms, by the appearance of an ∼7-kb band in contrast to the ∼14-kb wild-type (wt) band, correct homologous recombination of one allele. KO, knockout.
FIG. 2.
FIG. 2.
Expression of Eset during mouse embryonic development. Eset transcription was analyzed by X-Gal staining, which detects lacZ expression from the targeted Eset allele. (A) Four-cell and eight-cell oocytes, morulae, and blastocysts derived from intercrosses of Eset+/− mice were all positive for X-Gal staining (left). In contrast, embryos derived from crosses between an Eset+/− male and a wild-type female were almost all negative for X-Gal staining from the two-cell stage through the morula stage (right). Only 1 of 27 morulae was X-Gal positive, whereas about one-half (19 of 31) of the blastocysts were X-Gal positive. (B to D) X-Gal staining of Eset+/− embryos at 7.5, 8.5, and 9.5 dpc showed ubiquitous expression of Eset throughout the entire embryo proper. In panels C and D the yolk sac is still attached to the embryo and also stained positive for X-Gal.
FIG. 2.
FIG. 2.
Expression of Eset during mouse embryonic development. Eset transcription was analyzed by X-Gal staining, which detects lacZ expression from the targeted Eset allele. (A) Four-cell and eight-cell oocytes, morulae, and blastocysts derived from intercrosses of Eset+/− mice were all positive for X-Gal staining (left). In contrast, embryos derived from crosses between an Eset+/− male and a wild-type female were almost all negative for X-Gal staining from the two-cell stage through the morula stage (right). Only 1 of 27 morulae was X-Gal positive, whereas about one-half (19 of 31) of the blastocysts were X-Gal positive. (B to D) X-Gal staining of Eset+/− embryos at 7.5, 8.5, and 9.5 dpc showed ubiquitous expression of Eset throughout the entire embryo proper. In panels C and D the yolk sac is still attached to the embryo and also stained positive for X-Gal.
FIG. 3.
FIG. 3.
Fate of Eset−/− embryos. (A) An Eset−/− embryo (left) and an Eset+/− littermate at 7.5 dpc. All Eset−/− embryos (Em) at 7.5 dpc were severely malformed, with only the ectoplacental cone discernible (Ec). (B to E) Approximately sagittal sections from presumptive Eset−/− embryos (B and D) show extensive resorption and the absence of any detectable structure of the embryo proper at 5.5 and 6.5 dpc (arrows [D and E], ectoplacental cones; dotted lines, general outline of each decidua); the majority of embryos showing normal morphology at 5.5 and 6.5 dpc (C and E) were presumptive Eset+/− or wild-type embryos (2 litters each; 2 of 14 at 5.5 dpc appeared to be resorbing, and 2 of 17 at 6.5 dpc appeared to be resorbing). (F) Results of Eset+/− intercrosses. After 7.5 dpc no Eset−/− embryos were recovered at 9.5, 12.5, or 16.5 dpc, and no viable pups were recovered at weaning. nd, not determined.
FIG. 4.
FIG. 4.
Defective ICM outgrowth of Eset−/− blastocysts. (A) After 3 to 4 days of culture many wild-type and Eset+/− blastocyst outgrowths show normal ICM morphology above the trophectodermal cell layer. Here, an Eset+/− culture is shown (see Table 1). (B) Of the 24 Eset−/− blastocysts obtained, 18 showed defective ICM morphology after 3 to 4 days in culture; the example shown here is a particularly severe one. (C) PCR genotyping of the remaining trophectodermal cells after picking up the ICM outgrowth for the derivation of ES cells allowed the determination of the genotype by size separation on a 3% agarose gel. wt, wild type; KO, knockout. (D) Schematic of the PCR genotyping protocol. The same forward primer anneals to both the targeted (KO) and wild-type Eset alleles, but the reverse primers are specific to either the wild-type Eset locus or the IRES-β-geo inserted cassette and are distinguished by their different sizes.
FIG. 5.
FIG. 5.
Di- and trimethylation of H3-K9 in the Eset−/− blastocyst. Thirty-three blastocysts from Eset+/− intercrosses were used. (A) Bright-field microscopy showed normal morphology of all blastocysts. (B) Immunostaining of blastocysts with an anti-dimethyl-H3-K9 antibody. No differences in staining among the 33 blastocysts were detected. (C) Immunostaining of blastocysts with an anti-trimethyl-H3-K9 antibody. No differences among the 33 blastocysts were detected. (D) Merge of images in panels B and C. The anti-di- and anti-trimethyl-H3-K9 signals show colocalization, as judged by the appearance of orange in the merged images. (E) DAPI staining of DNA (blue).
FIG. 6.
FIG. 6.
ESET protein expression and H3-K9 trimethylation (H3-m3K9) in blastocyst outgrowths. (A) Wild-type mice were intercrossed to ensure that ESET was detectable by immunostaining. All 10 blastocyst outgrowths derived from wild-type intercrosses showed similar levels of staining with an ESET antibody (red) and an H3-K9 trimethylation antibody (green). The DNA is detected by DAPI staining (blue), and the merged image shows colocalization of ESET and H3-K9 trimethylation. (B) Experiments similar to those shown in panel A were performed using blastocyst outgrowths from intercrosses of Eset+/− mice. A variation in the ESET signal (red) among the 21 blastocyst outgrowths was readily observed; however, the loss of ESET signal (red) did not correlate with the loss of the H3-K9 trimethylation signal (green). The DNA was detected by DAPI staining (blue), and the merged image shows colocalization of ESET and H3-K9 trimethylation. Two blastocyst outgrowths that show low ESET signal are highlighted with white circles for comparison with the still-detectable H3-K9 trimethylation signal.
FIG. 7.
FIG. 7.
DNA methylation analysis of IAP repeats isolated after 3 days of ICM growth in culture. (A) A total of 46% of all CpG sites were methylated in the DNA recovered from the three or four pooled ICM samples obtained from Eset+/− blastocyst outgrowths. As described previously the remaining trophectodermal cells were used for PCR genotyping. (B) A total of 36% of all CpG sites were methylated in the DNA recovered from three or four pooled ICMs obtained from Eset−/− blastocyst outgrowths.

References

    1. Beard, C., E. Li, and R. Jaenisch. 1995. Loss of methylation activates Xist in somatic but not in embryonic cells. Genes Dev. 9:2325-2334. - PubMed
    1. Bourc'his, D., G. L. Xu, C. S. Lin, B. Bollman, and T. H. Bestor. 2001. Dnmt3L and the establishment of maternal genomic imprints. Science 294:2536-2539. - PubMed
    1. Dodge, J. E., A. F. List, and B. W. Futscher. 1998. Selective variegated methylation of the p15 CpG island in acute myeloid leukemia. Int. J. Cancer 78:561-567. - PubMed
    1. Donohoe, M. E., X. Zhang, L. McGinnis, J. Biggers, E. Li, and Y. Shi. 1999. Targeted disruption of mouse Yin Yang 1 transcription factor results in peri-implantation lethality. Mol. Cell. Biol. 19:7237-7244. - PMC - PubMed
    1. Gaudet, F., J. G. Hodgson, A. Eden, L. Jackson-Grusby, J. Dausman, J. W. Gray, H. Leonhardt, and R. Jaenisch. 2003. Induction of tumors in mice by genomic hypomethylation. Science 300:489-492. - PubMed

Publication types

MeSH terms