Review
. 2001 Apr;1(1):54-63.

Pharmacogenomics of cystic fibrosis

Affiliations
Review

Pharmacogenomics of cystic fibrosis

H B Pollard et al. Mol Interv. 2001 Apr.

Abstract

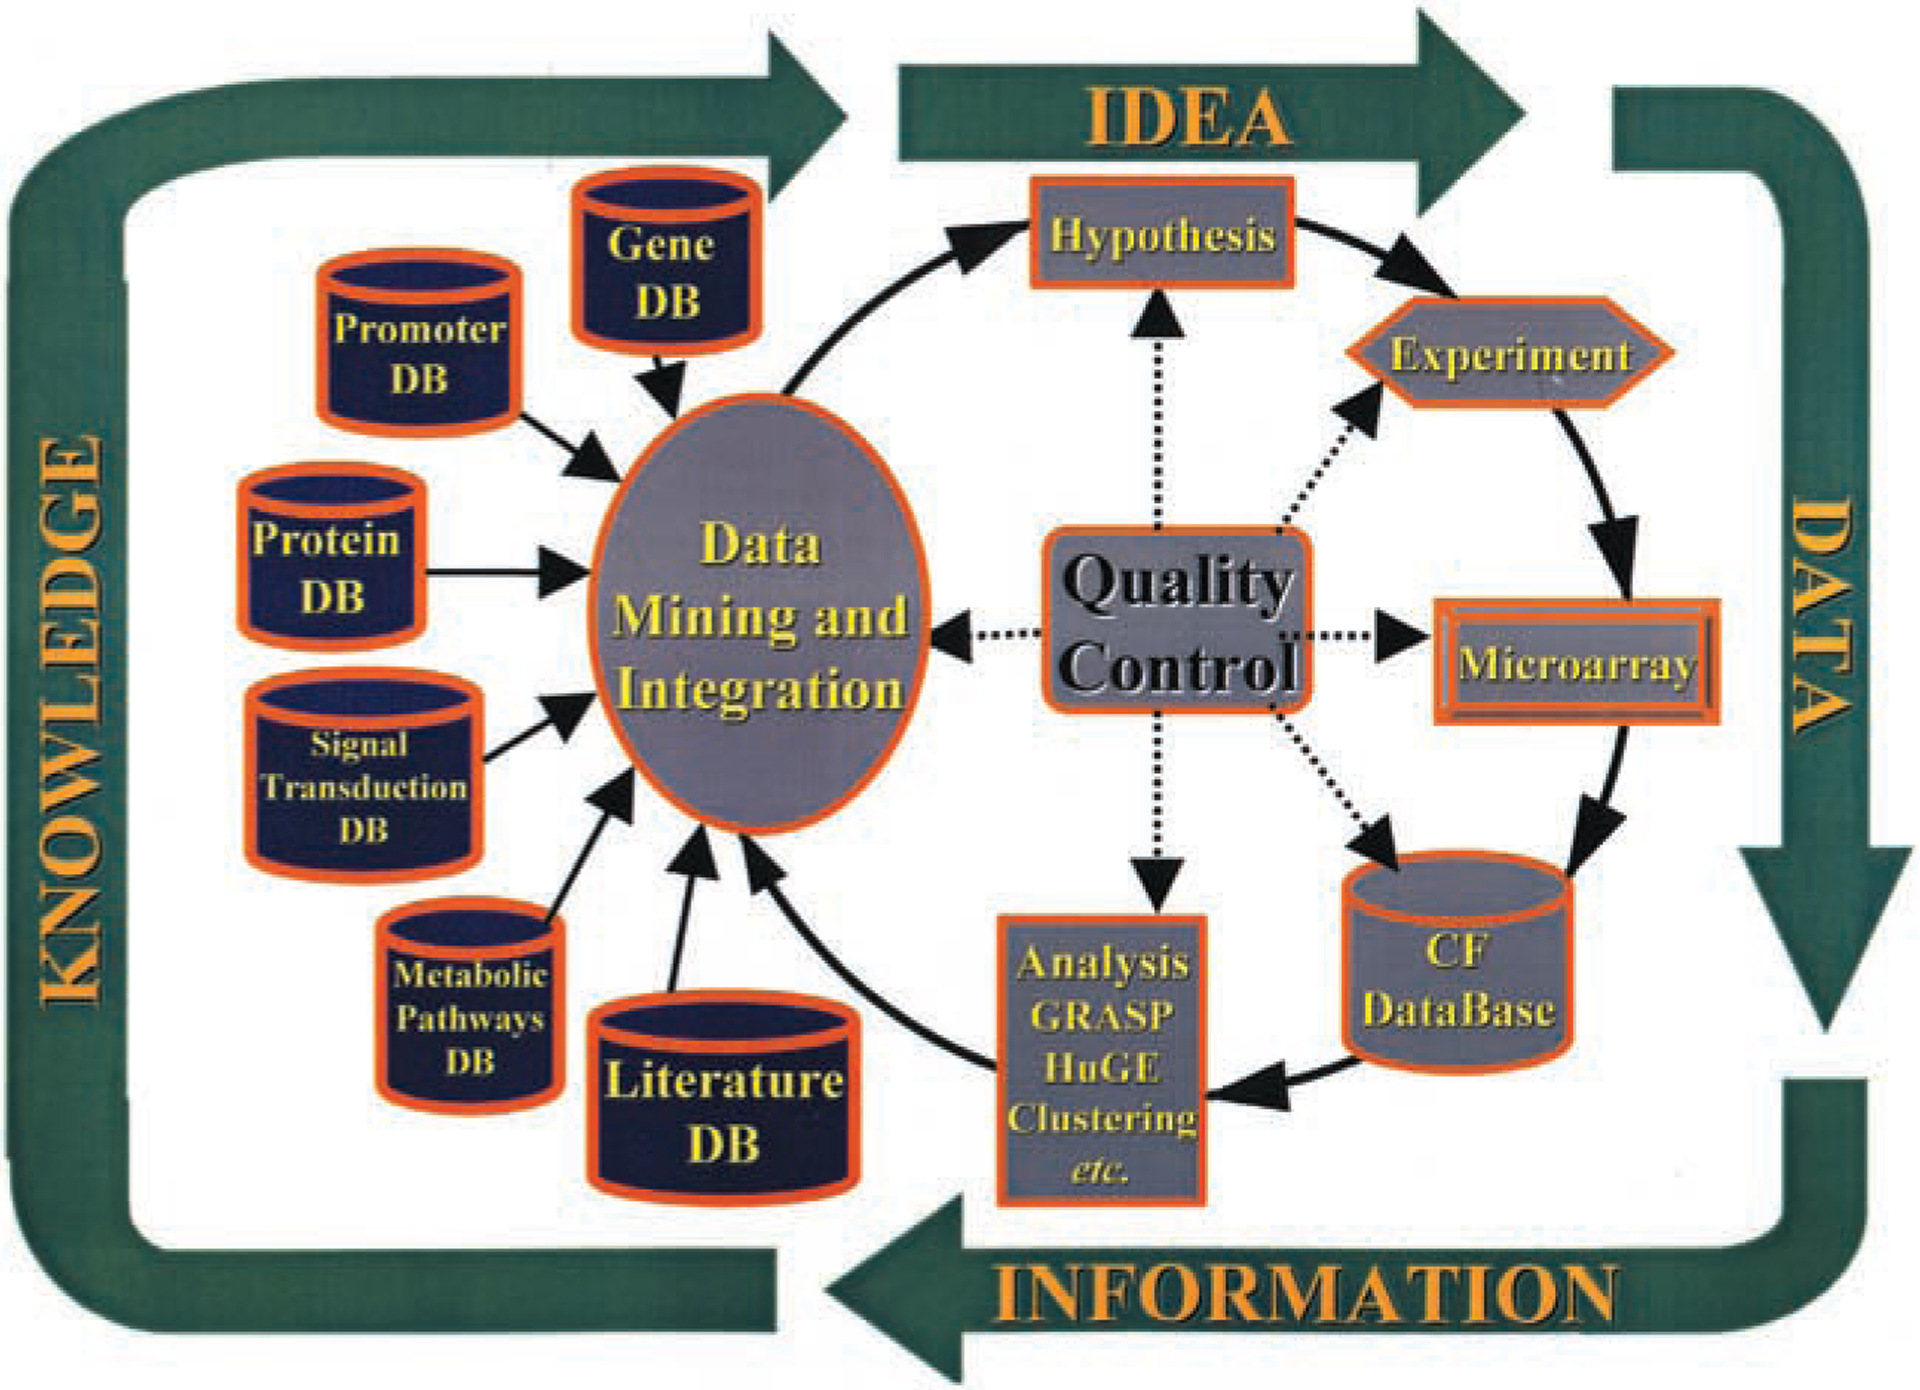
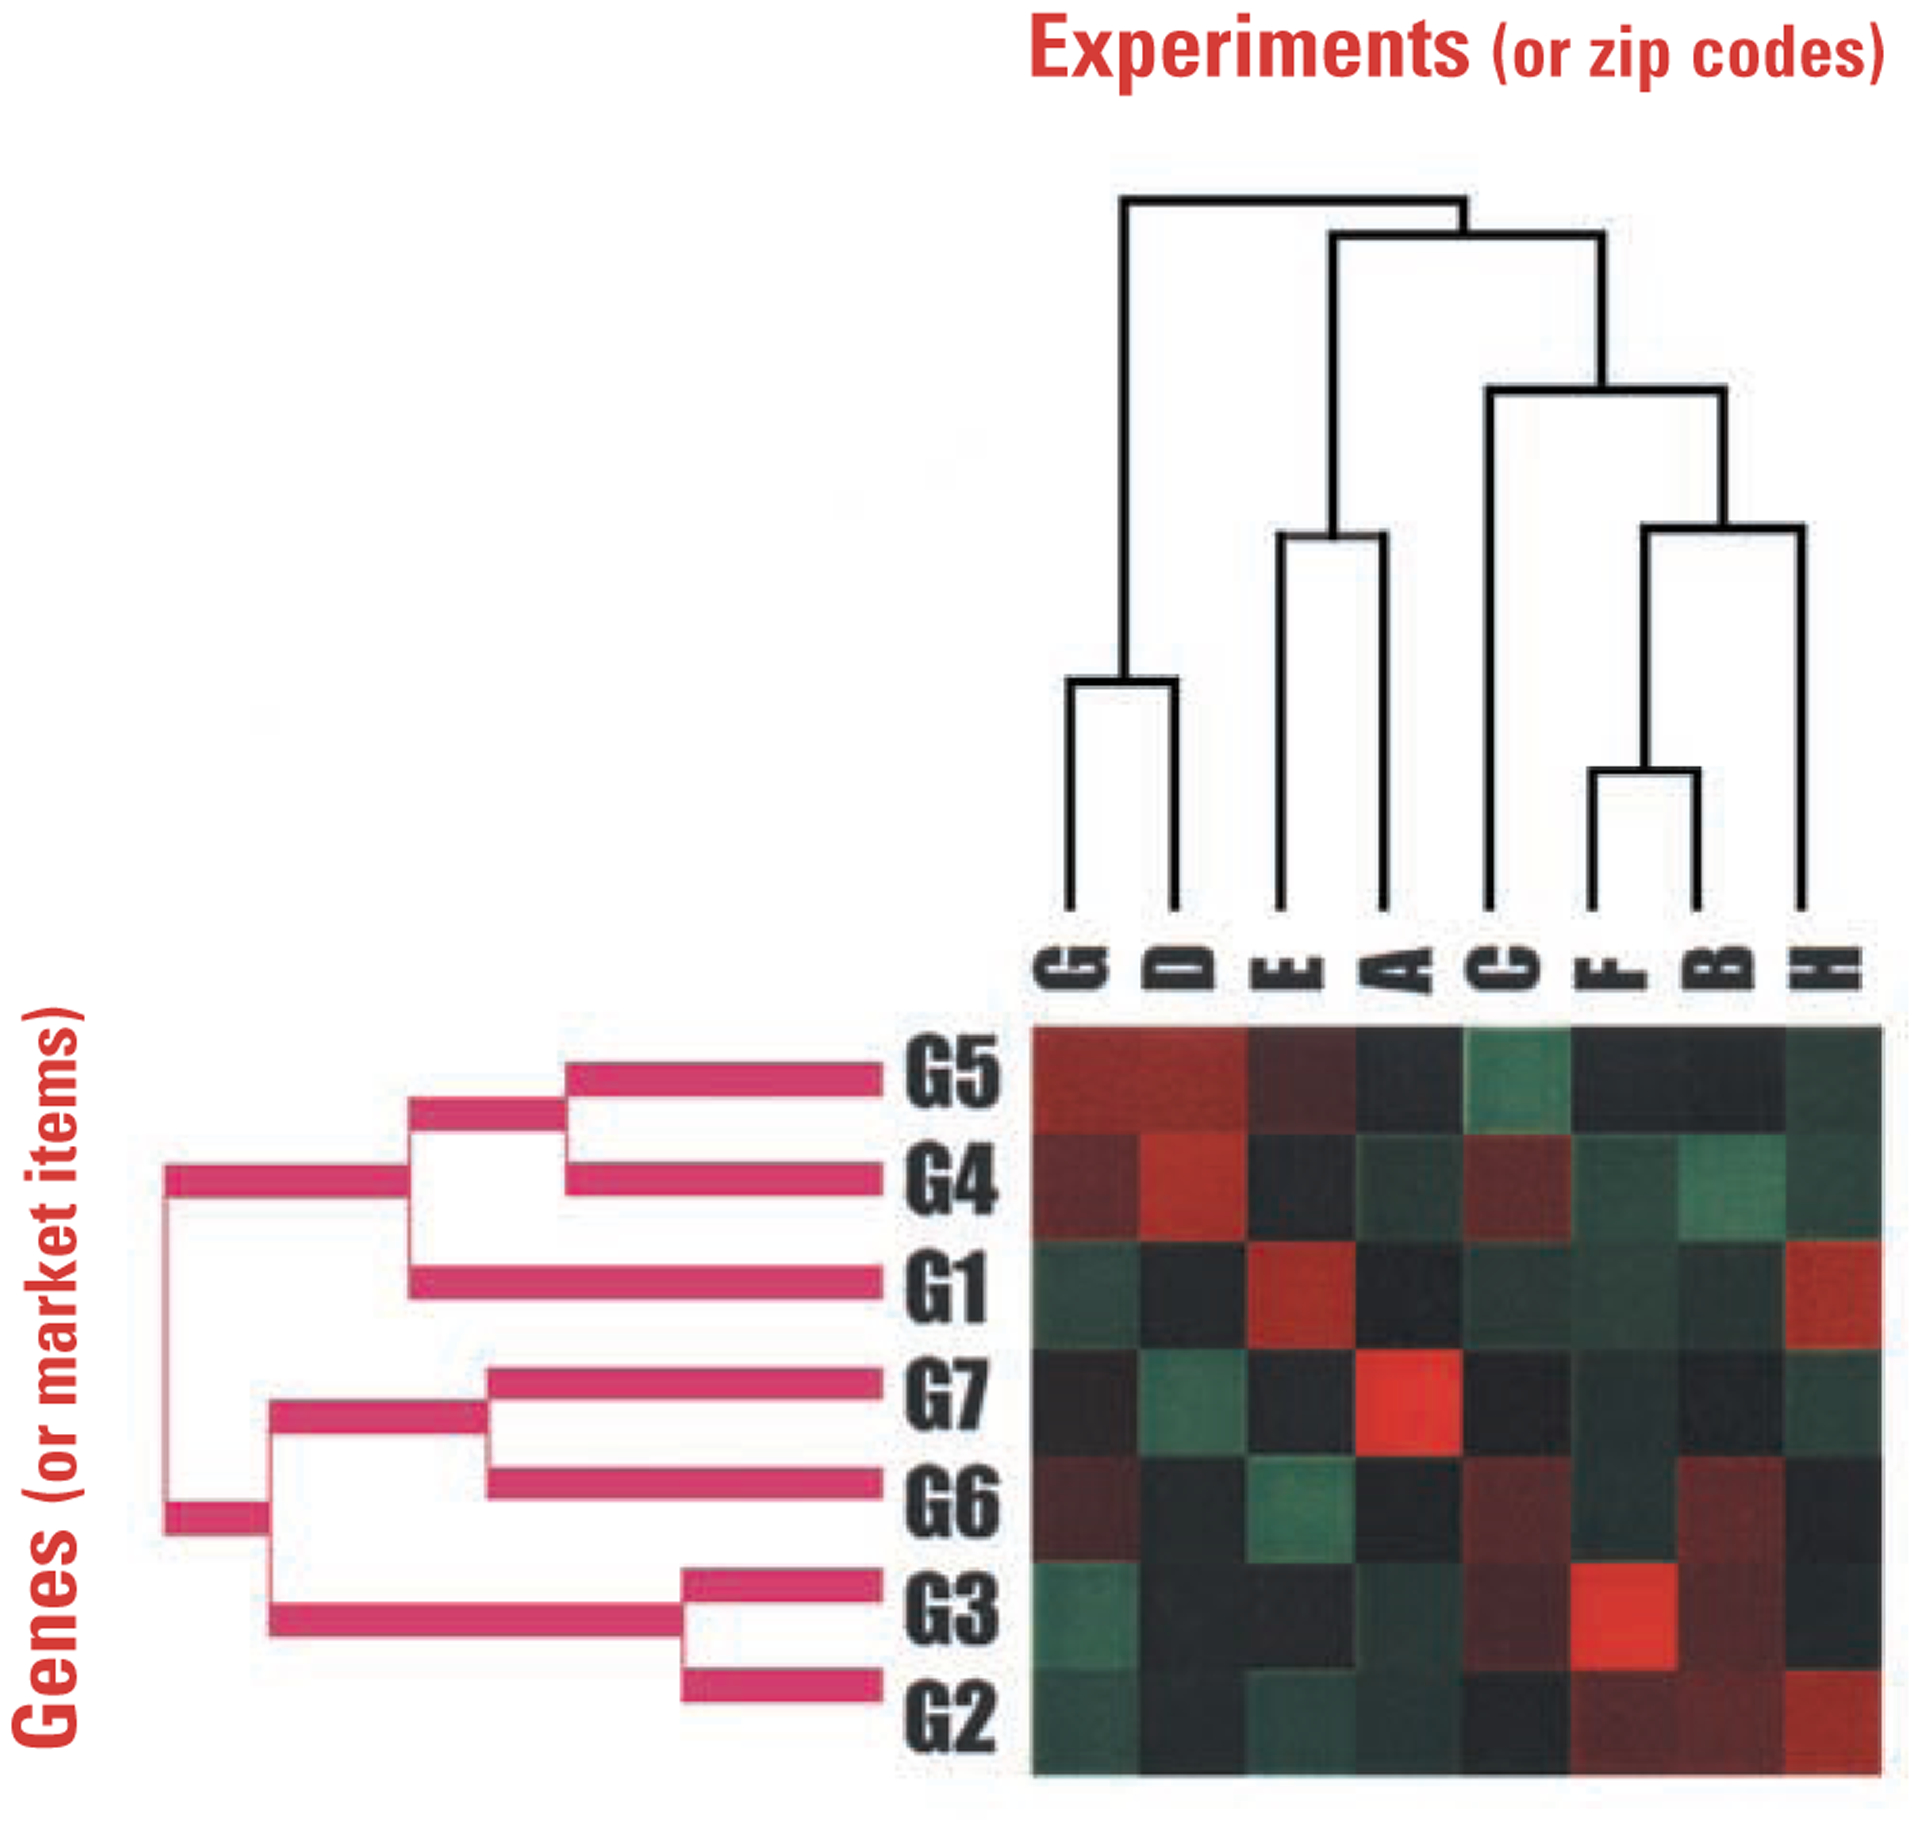
Pharmacogenomics is becoming a frontline instrument of drug discovery, where the drug-dependent patterns of global gene expression are employed as biologically relevant end points. In the case of cystic fibrosis (CF), cells and tissues from CF patients provide the starting points of genomic analysis. The end points for drug discovery are proposed to reside in gene expression patterns of CF cells that have been corrected by gene therapy. A case is made here that successful drug therapy and gene therapy should, hypothetically, converge at a common end point. In response to a virtual tidal wave of genomic data, bioinformatics algorithms are needed to identify those genes that truly reveal drug efficacy. As examples, we describe the hierarchical clustering, GRASP, and GENESAVER algorithms, particularly within a hypothesis-driven context that focuses on data for a CF candidate drug. Pharmacogenomic approaches to CF, and other similar diseases, may eventually give us the opportunity to create drugs that work in a patient- or mutation-specific manner.


Figures

Figure 1.
Figure 1.. Hypothesis-driven approach to the bioinformatics of cystic fibrosis (CF).
The usefulness of GRASP and GENESAVER algorithms for hypothesis-driven genomic analysis is discussed in the text. The strategy is widely applicable to other diseases.
Figure 2.
Figure 2.. Application of the hierarchical clustering algorithm to genomics and marketing.
The origins of the high-quality hierarchical clustering algorithms used for genomic analysis lie in economic analysis. In genomic analysis, patients or experiments are clustered with each other in terms of gene expression. Analogously, customer identifiers, such as zip codes, are associated with purchased items. Optimal associations are formed between nearest neighbors in terms of dyadic branches on a relational tree. We used a random number generator to provide the data example in this figure, and the algorithm provided the array. The graded red and green colors, customary in genomic analysis, represent positive and negative extremes. For example, note the clustering of experiments F and B with respect to their similar sets of colors, and their separation from the disparate color sets of experiments G and D.
Figure 3.
Figure 3.. Geographical map explaining the weakness of the hierarchical clustering algorithm.
Two small islands in the South Pacific (small red and yellow circles) are close together. When grouped with nearby landmasses, however, one of the islands becomes grouped with Borneo, whereas the other is grouped with New Guinea. On a larger scale, the red-ringed island becomes grouped with Australia, whereas the yellow-ringed island becomes grouped with Asia. Thus, the algorithm can map two entities that are in reality quite close as being distal to one another. On the other hand, when the algorithm describes two entities as being proximal to each other, the description is generally very reliable.
Figure 4.
Figure 4.. Genomic space as an indicator of the genomic state of cells in response to the drug candidate CPX.
A. Genomic space is defined by a graph of global gene expression levels in HEK293 cells bearing either the wild-type (control; horizontal axis) or mutant CFTR gene (vertical axis). Levels of gene expression that are equivalent in the two cell populations will fall on the diagonal, whereas expression that is affected by the mutant CFTR are off the diagonal. Significant deviation from the diagonal can be defined in terms of standard deviations (see dotted lines on either side of the diagonal). The angle α denotes the direction of “movement in genomic space” in response to CPX; vector length denotes the magnitude of “movement”. The gene denoted by α1 is a mutation-dependent gene (i.e., deviates from the diagonal) whose expression is “moved” by the drug in a mutation-independent manner (i.e., “movement” is parallel to the diagonal). The gene denoted by α2 is a mutation-dependent gene whose expression is “moved” into the diagonal by the drug in a mutation-dependent manner; the drug thus brings the genomic state of the mutation-bearing cells (with respect to the gene denoted by α2) into closer agreement with the wild-type genomic state. B. Radial plots of a complete data set from HEK293 cells, expressing mutant or wild-type CFTR, treated with CPX. The plot on the left is at low resolution; the plot on the right is at higher resolution. Drug-dependent movement up and down the diagonal is along the 45°/225° angle. Mutation-specific movement is approximately perpendicular to this diagonal. The radius is given in numbers of genes moving at a given angle. (Data are abstracted from (32); sd, standard deviation.)
Figure 5.
Figure 5.. Seven-dimensional analysis of genes identified as CF-relevant by the GENESAVER algorithm.
Only 16 genes are shown out of thousands of possibilities. The vectors are then compared to the magnitude and direction of a physiological variable, for example IL8 secretion. See text for details.

Similar articles

Cited by

References

    1. Lockhart DJ and Winzeler DA Genomics, gene expression and DNA arrays. Nature 405, 827–836 (2000). - PubMed
    1. Debouck C and Metcalf B The impact of genomics on drug discovery. Annu.Rev. Pharmacol. Toxicol 40, 193–207 (2000). - PubMed
    1. Young RA Biomedical discovery with DNA arrays. Cell 102, 9–15 (2000). - PubMed
    1. Roses AD Pharmacogenetics and the practice of medicine. Nature 405, 857–865 (2000). - PubMed
    1. Pollard HB Anatomical Genomics: Systems of genes underlying the biology of systems. Anatomical Record 259, iii–ix (2000). - PubMed

Substances