

Differential tumor necrosis factor receptor 2-mediated editing of virus-specific CD8+ effector T cells
- PMID: 14993609
- PMCID: PMC373499
- DOI: 10.1073/pnas.0307347101
Differential tumor necrosis factor receptor 2-mediated editing of virus-specific CD8+ effector T cells
Abstract
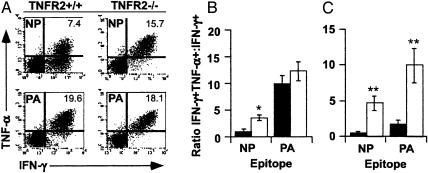
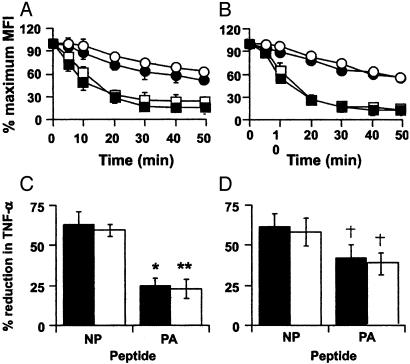
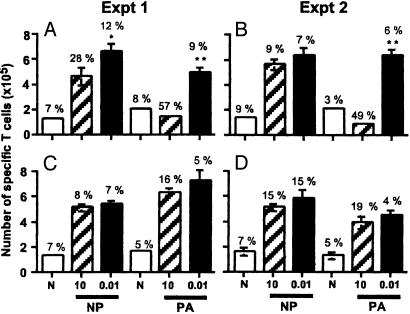
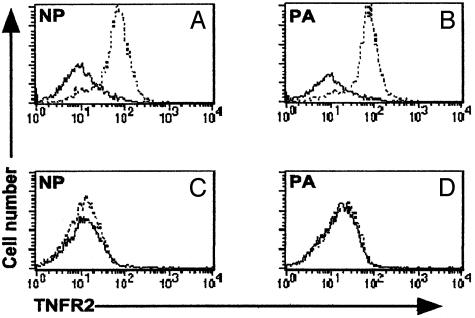
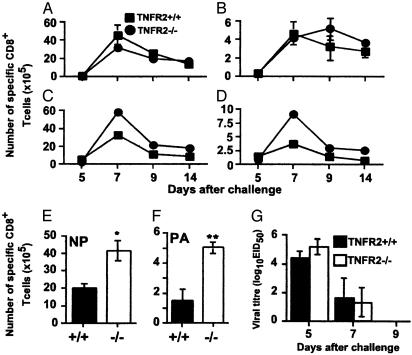
Much of the CD8(+) T cell response in H2(b) mice with influenza pneumonia is directed at the nucleoprotein(366-374) (NP(366)) and acid polymerase(224-233) (PA(224)) peptides presented by the H2D(b) MHC class I glycoprotein. These D(b)NP(366)- and D(b)PA(224)-specific T cell populations are readily analyzed by staining with tetrameric complexes of MHC(+) peptide (tetramers) or by cytokine production subsequent to in vitro stimulation with the cognate peptides. The D(b)PA(224)-specific CD8(+) effector T cells make more tumor necrosis factor (TNF) alpha than the comparable CD8(+)D(b)NP(366)(+) set, a difference reflected in the greater sensitivity of the CD8(+)D(b)PA(224)(+) population to TNF receptor (TNFR) 2-mediated apoptosis under conditions of in vitro culture. Freshly isolated CD8(+)D(b)NP(366)(+) and CD8(+)D(b)PA(224)(+) T cells from influenza-infected TNFR2(-/-) mice produce higher levels of IFN-gamma and TNF-alpha after in vitro stimulation with peptide, although the avidity of the T cell receptor-epitope interaction does not change. Increased numbers of both CD8(+)D(b)PA(224)(+) and CD8(+)D(b)NP(366)(+) T cells were recovered from the lungs (but not the spleens) of secondarily challenged TNFR2(-/-) mice, a pattern that correlates with the profiles of TNFR expression in the TNFR2(+/+) controls. Thus, it seems that TNFR2-mediated editing of influenza-specific CD8(+) T cells functions to limit the numbers of effectors that have localized to the site of pathology in the lung but does not modify the size of the less activated responder T cell populations in the spleen. Therefore, the massive difference in magnitude for the secondary, although not the primary, response to these D(b)NP(366) and D(b)PA(224) epitopes cannot be considered to reflect differential TNFR2-mediated T cell editing.
Figures
Similar articles
-
Hierarchies in cytokine expression profiles for acute and resolving influenza virus-specific CD8+ T cell responses: correlation of cytokine profile and TCR avidity.J Immunol. 2004 May 1;172(9):5553-60. doi: 10.4049/jimmunol.172.9.5553. J Immunol. 2004. PMID: 15100298
-
Fixing an irrelevant TCR alpha chain reveals the importance of TCR beta diversity for optimal TCR alpha beta pairing and function of virus-specific CD8+ T cells.Eur J Immunol. 2010 Sep;40(9):2470-81. doi: 10.1002/eji.201040473. Eur J Immunol. 2010. PMID: 20690181
-
A virus-specific CD8+ T cell immunodominance hierarchy determined by antigen dose and precursor frequencies.Proc Natl Acad Sci U S A. 2006 Jan 24;103(4):994-9. doi: 10.1073/pnas.0510429103. Epub 2006 Jan 17. Proc Natl Acad Sci U S A. 2006. PMID: 16418289 Free PMC article.
-
The Significance of Tumor Necrosis Factor Receptor Type II in CD8+ Regulatory T Cells and CD8+ Effector T Cells.Front Immunol. 2018 Mar 22;9:583. doi: 10.3389/fimmu.2018.00583. eCollection 2018. Front Immunol. 2018. PMID: 29623079 Free PMC article. Review.
-
Cytotoxic T cells in influenza infection.Ann N Y Acad Sci. 1988;532:230-7. doi: 10.1111/j.1749-6632.1988.tb36342.x. Ann N Y Acad Sci. 1988. PMID: 2845845 Review. No abstract available.
Cited by
-
Regulation of inflammation-associated olfactory neuronal death and regeneration by the type II tumor necrosis factor receptor.Int Forum Allergy Rhinol. 2013 Sep;3(9):740-7. doi: 10.1002/alr.21187. Epub 2013 Jun 3. Int Forum Allergy Rhinol. 2013. PMID: 23733314 Free PMC article.
-
Negative regulation of lung inflammation and immunopathology by TNF-α during acute influenza infection.Am J Pathol. 2011 Dec;179(6):2963-76. doi: 10.1016/j.ajpath.2011.09.003. Epub 2011 Oct 14. Am J Pathol. 2011. PMID: 22001698 Free PMC article.
-
Extrinsically derived TNF is primarily responsible for limiting antiviral CD8+ T cell response magnitude.PLoS One. 2017 Sep 8;12(9):e0184732. doi: 10.1371/journal.pone.0184732. eCollection 2017. PLoS One. 2017. PMID: 28886201 Free PMC article.
-
Intrinsic TNF/TNFR2 interactions fine-tune the CD8 T cell response to respiratory influenza virus infection in mice.PLoS One. 2013 Jul 9;8(7):e68911. doi: 10.1371/journal.pone.0068911. Print 2013. PLoS One. 2013. PMID: 23874808 Free PMC article.
-
TNF receptor 1 mediates dendritic cell maturation and CD8 T cell response through two distinct mechanisms.J Immunol. 2011 Aug 1;187(3):1184-91. doi: 10.4049/jimmunol.1002902. Epub 2011 Jun 27. J Immunol. 2011. PMID: 21709152 Free PMC article.
References
-
- Allan, W., Tabi, Z., Cleary, A. & Doherty, P. C. (1990) J. Immunol. 144, 3980-3986. - PubMed
-
- Doherty, P. C. & Christensen, J. P. (2000) Annu. Rev. Immunol. 18, 561-592. - PubMed
-
- Flynn, K. J., Belz, G. T., Altman, J. D., Ahmed, R., Woodland, D. L. & Doherty, P. C. (1998) Immunity 8, 683-691. - PubMed
Publication types
MeSH terms
Substances
Grants and funding
LinkOut - more resources
Full Text Sources
Other Literature Sources
Molecular Biology Databases
Research Materials
Miscellaneous
