

In-depth profiling of lysine-producing Corynebacterium glutamicum by combined analysis of the transcriptome, metabolome, and fluxome
- PMID: 14996808
- PMCID: PMC355958
- DOI: 10.1128/JB.186.6.1769-1784.2004
In-depth profiling of lysine-producing Corynebacterium glutamicum by combined analysis of the transcriptome, metabolome, and fluxome
Abstract
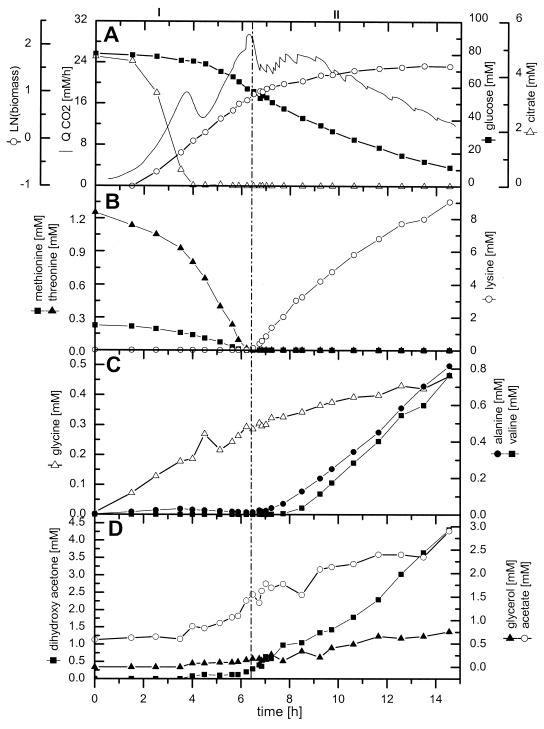
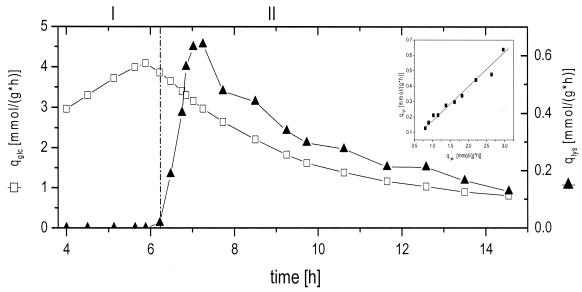
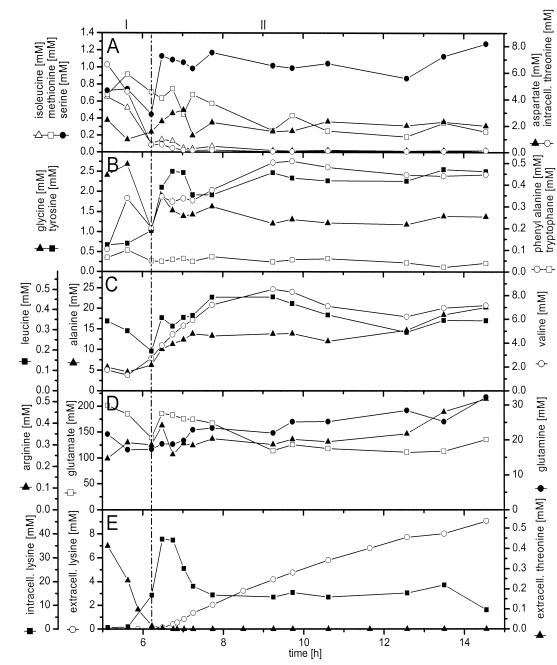
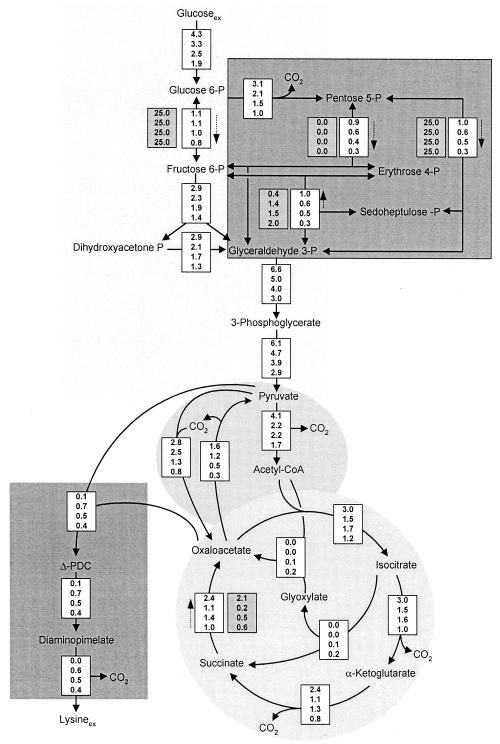
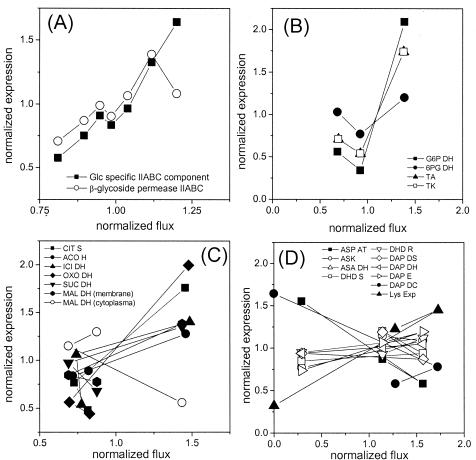
An in-depth analysis of the intracellular metabolite concentrations, metabolic fluxes, and gene expression (metabolome, fluxome, and transcriptome, respectively) of lysine-producing Corynebacterium glutamicum ATCC 13287 was performed at different stages of batch culture and revealed distinct phases of growth and lysine production. For this purpose, 13C flux analysis with gas chromatography-mass spectrometry-labeling measurement of free intracellular amino acids, metabolite balancing, and isotopomer modeling were combined with expression profiling via DNA microarrays and with intracellular metabolite quantification. The phase shift from growth to lysine production was accompanied by a decrease in glucose uptake flux, the redirection of flux from the tricarboxylic acid (TCA) cycle towards anaplerotic carboxylation and lysine biosynthesis, transient dynamics of intracellular metabolite pools, such as an increase of lysine up to 40 mM prior to its excretion, and complex changes in the expression of genes for central metabolism. The integrated approach was valuable for the identification of correlations between gene expression and in vivo activity for numerous enzymes. The glucose uptake flux closely corresponded to the expression of glucose phosphotransferase genes. A correlation between flux and expression was also observed for glucose-6-phosphate dehydrogenase, transaldolase, and transketolase and for most TCA cycle genes. In contrast, cytoplasmic malate dehydrogenase expression increased despite a reduction of the TCA cycle flux, probably related to its contribution to NADH regeneration under conditions of reduced growth. Most genes for lysine biosynthesis showed a constant expression level, despite a marked change of the metabolic flux, indicating that they are strongly regulated at the metabolic level. Glyoxylate cycle genes were continuously expressed, but the pathway exhibited in vivo activity only in the later stage. The most pronounced changes in gene expression during cultivation were found for enzymes at entry points into glycolysis, the pentose phosphate pathway, the TCA cycle, and lysine biosynthesis, indicating that these might be of special importance for transcriptional control in C. glutamicum.
Figures
References
-
- Al Zaid Siddiquee, K., M. J. Arauzo-Bravo, and K. Shimizu. 2004. Metabolic flux analysis of pykF gene knockout Escherichia coli based on 13C-labeling experiments together with measurements of enzyme activities and intracellular metabolite concentrations. Appl. Microbiol. Biotechnol. 63:407-417. - PubMed
-
- Bathe, B., J. Kalinowski, and A. Pühler. 1996. A physical and genetic map of the Corynebacterium glutamicum ATCC 13032 chromosome. Mol. Gen. Genet. 252:255-265. - PubMed
-
- Dauner, M., and U. Sauer. 2000. GC-MS analysis of amino acids rapidly provides rich information for isotopomer balancing. Biotechnol. Prog. 16:642-649. - PubMed
-
- de Graaf, A. A. 2000. Metabolic flux analysis of Corynebacterium glutamicum, p. 506-555. In K. Schügerl and K. H. Bellgardt (ed.), Bioreaction engineering. Springer Verlag, Berlin, Germany.
-
- Dominguez, H., C. Rollin, A. Guyonvarch, J.-L. Guerquin-Kern, and M. Cocaign-Bousquet. 1998. Carbon-flux distribution in the central metabolic pathways of Corynebacterium glutamicum during growth on fructose. Eur. J. Biochem. 254:96-102. - PubMed
MeSH terms
Substances
LinkOut - more resources
Full Text Sources
Other Literature Sources
