. 2004 Mar;186(6):1838-50.
doi: 10.1128/JB.186.6.1838-1850.2004.

Quorum sensing in Staphylococcus aureus biofilms

Affiliations

Quorum sensing in Staphylococcus aureus biofilms

Jeremy M Yarwood et al. J Bacteriol. 2004 Mar.

Abstract

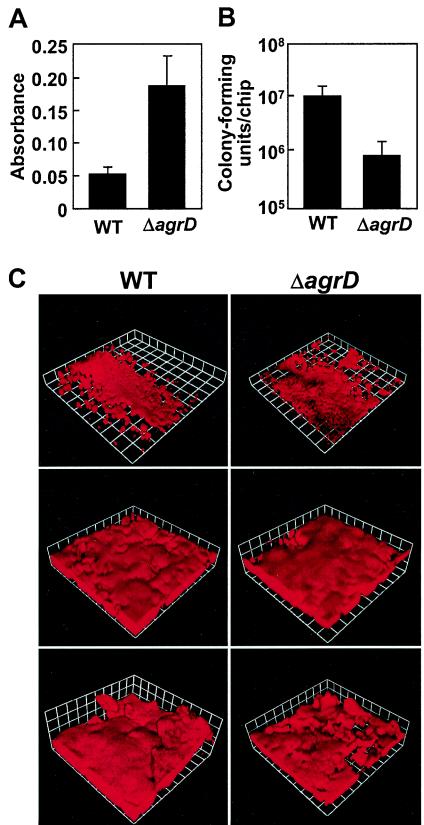
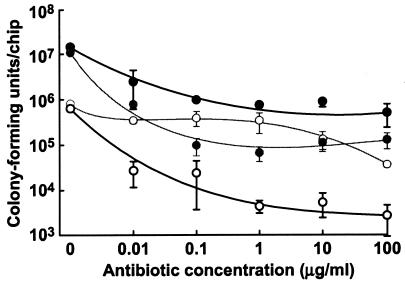
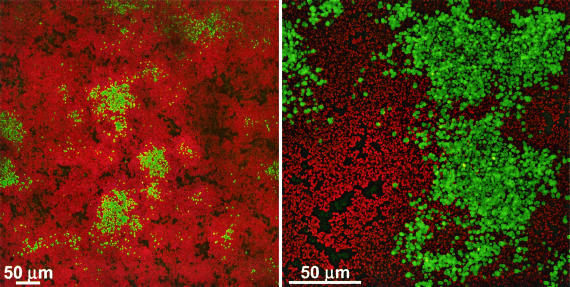
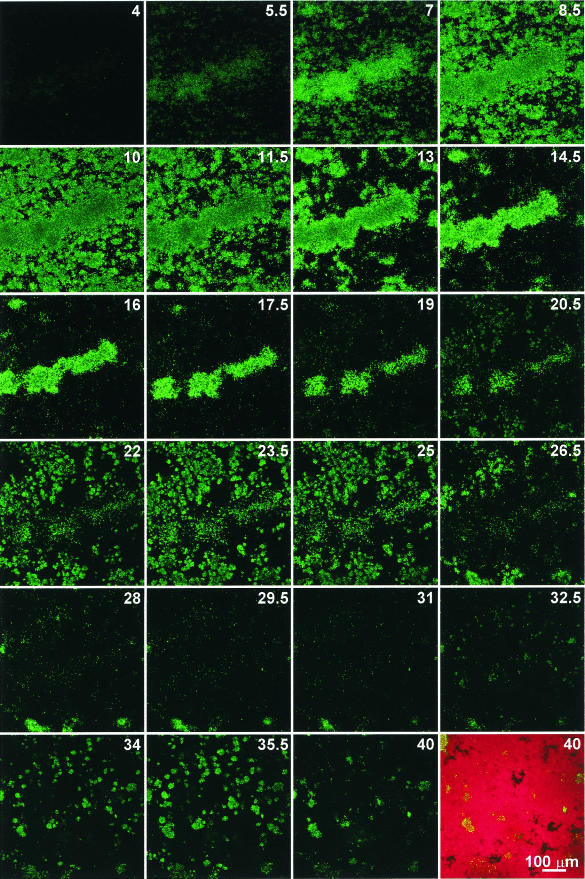
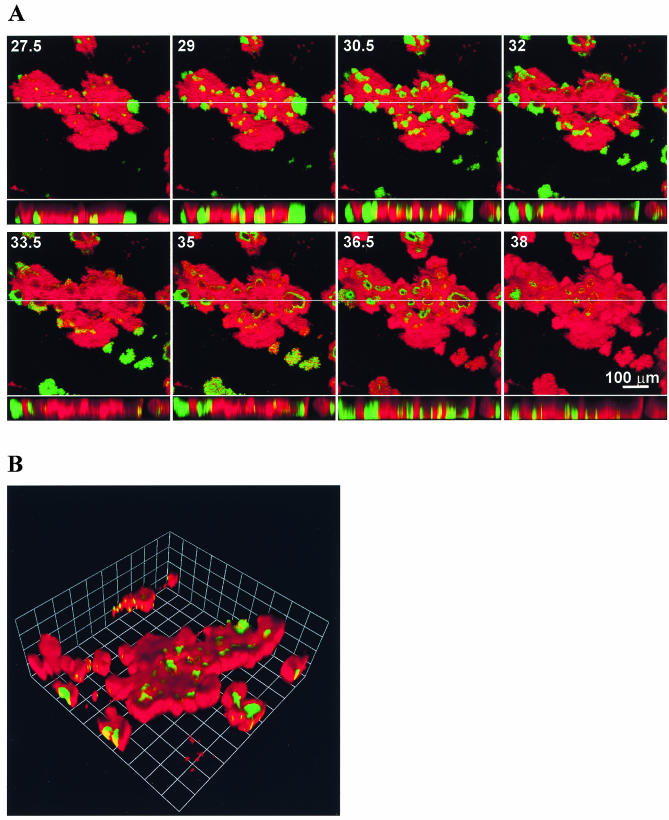
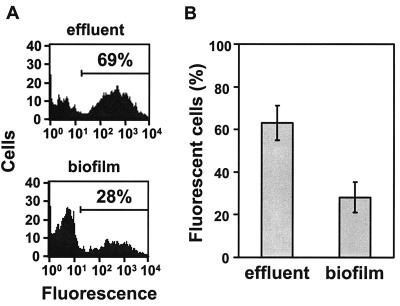
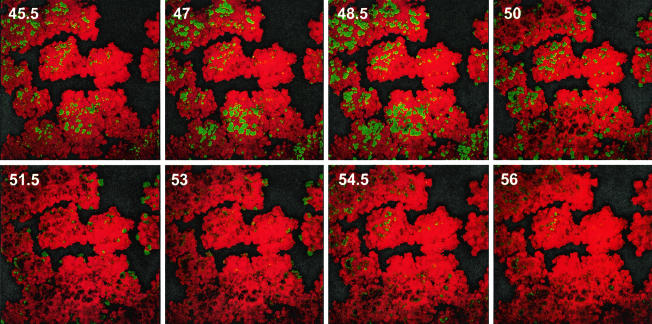
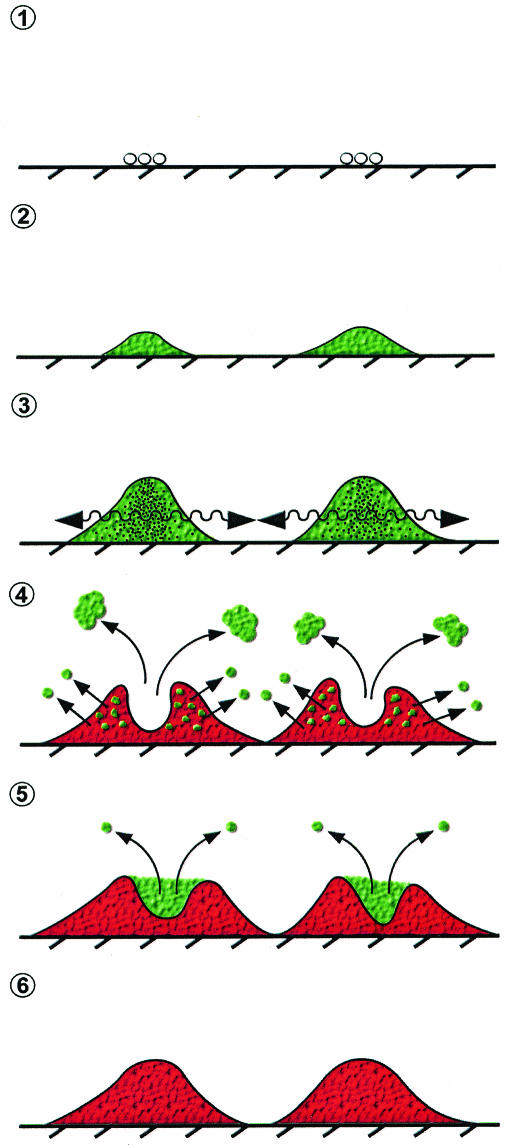
Several serious diseases are caused by biofilm-associated Staphylococcus aureus, infections in which the accessory gene regulator (agr) quorum-sensing system is thought to play an important role. We studied the contribution of agr to biofilm development, and we examined agr-dependent transcription in biofilms. Under some conditions, disruption of agr expression had no discernible influence on biofilm formation, while under others it either inhibited or enhanced biofilm formation. Under those conditions where agr expression enhanced biofilm formation, biofilms of an agr signaling mutant were particularly sensitive to rifampin but not to oxacillin. Time lapse confocal scanning laser microscopy showed that, similar to the expression of an agr-independent fluorescent reporter, biofilm expression of an agr-dependent reporter was in patches within cell clusters and oscillated with time. In some cases, loss of fluorescence appeared to coincide with detachment of cells from the biofilm. Our studies indicate that the role of agr expression in biofilm development and behavior depends on environmental conditions. We also suggest that detachment of cells expressing agr from biofilms may have important clinical implications.


Figures

FIG. 1.
FIG. 1.
Influence of agr on biofilm development under different growth conditions. The S. aureus parent strain, MN8 (WT), and the agrD mutant (ΔagrD) were grown in microtiter dish assays (A), spinning-disk reactors (B), and flow cells (C). (A) Microtiter dish biofilm mass as measured by crystal violet staining. The data represent the means and standard deviations of 18 replicate wells. (B) CFU recovered from rotating-disk reactor chips. The data represent the means and standard deviations of duplicate chips taken from each of four independentspinning-disk reactors (total, eight chips) for each strain. There is a significant difference between the two strains (P = 0.03; Student's t test). (C) Three-dimensional reconstructions from days 1 (top) and 5 (middle and bottom) in flow cell biofilms stained with propidium iodide. Each side of a grid square is 60 μm. Microcolony sizes of biofilms of the wild type and the agrD mutant at 48 h were not significantly different. The average surface areas covered by microcolonies in biofilms of the parent and mutant were 0.020 and 0.025 mm2, respectively (determined by measuring 14 microcolonies of each strain in four different images acquired by light microscopy from two independent flow cell experiments; P = 0.43; Student's t test).
FIG. 2.
FIG. 2.
Quorum sensing and biofilm resistance to antibiotics. Spinning-disk reactor biofilms of the S. aureus parent strain, MN8 (solid circles), or the agrD mutant AMD283 (open circles) were treated with rifampin (bold lines) or oxacillin (thin lines), and survival was determined by plate counts. The data are averages from two chips from each of two spinning-disk bioreactors for each strain ± the range of means.
FIG. 3.
FIG. 3.
Expression of the agr P3-gfp reporter in flow cell biofilms of S. aureus MN8(pDB22). The images were acquired by CSLM with either a 20× (left) or 60× (right) objective lens. The images represent a compressed z series, where multiple x-y planes from top to bottom of the biofilm are combined. Green indicates those cells expressing GFP; all other cells appear red from treatment with SYTO62.
FIG. 4.
FIG. 4.
Time lapse expression of the agr P3-gfp reporter in a flow cell biofilm of S. aureus MN8(pDB22). The images were acquired at 15-min intervals by using identical CSLM settings with a 20× objective lens. Sequential images taken every 90 min are shown, with the number of hours postinoculation indicated. The final image (40 h postinoculation) is shown before and after treatment with SYTO62. The images represent a compressed z series, where multiple x-y planes from top to bottom of the biofilm are combined.
FIG. 5.
FIG. 5.
Time lapse expression of the agr P3-gfp reporter in a flow cell biofilm of S. aureus MN8(pJY202). The images were acquired at 15-min intervals by using identical CSLM settings with a 20× objective lens. Green indicates those cells expressing the reporter, and the remainder of the biofilm appears red from treatment with propidium iodide. (A) Sequential images taken every 90 min are shown, with the number of hours postinoculation indicated. The larger images represent a compressed z series, where multiple x-y planes from top to bottom of the biofilm are combined. The smaller images represent x-z (side) views of the biofilm at the location indicated by the line. (B) Three-dimensional reconstruction of a z series taken ∼36.5 h after inoculation in the experiment shown in panel A. Each side of a grid square represents 60 μm.
FIG. 6.
FIG. 6.
Expression of the agr P3-gfp reporter in flow cell biofilms and effluents after 60 h. Effluents were collected for ∼30 min from flow cells. Biofilms were then expelled from the same flow cells described in Materials and Methods. All collected cells were subsequently dispersed by ultrasonication and analyzed by flow cytometry for fluorescence (FL-1 channel). (A) Flow cytometry results from one representative flow cell biofilm and its effluent. The percentages represent the cells that fell within the range of fluorescence delineated by the marker. (B) Percentages of cells from quadruplicate flow cell biofilms and their effluents that were green fluorescent ± the standard deviation. The data are significant (P < 0.001; Student t test).
FIG. 7.
FIG. 7.
Time lapse expression of the sar P1-gfp reporter in a flow cell biofilm of S. aureus MN8(pJY209). The images were acquired at 15-min intervals by using identical CSLM settings with a 20× objective lens. Green indicates those cells expressing the reporter, and the remainder of the biofilm appears red from treatment with propidium iodide. Sequential images taken every 90 min are shown, with the number of hours postinoculation indicated.
FIG. 8.
FIG. 8.
Model of agr expression in S. aureus biofilms. After initial colonization by individual cells (step 1), microcolonies reach sufficient cell density for agr-dependent gene expression (step 2) and perhaps signaling between microcolonies (step 3, arrows). Portions of the biofilm detach through as-yet-unknown mechanisms (step 4), as either large aggregates or individual cells. Simultaneously, parts of the biofilm population become metabolically inactive and lose membrane integrity and green fluorescence. This is followed by new growth into the voids left by the detached cells (step 5), and the cycle is repeated. The microcolony finally reaches a relatively quiescent state where any growth is slow and agr expression is undetectable (step 6).

Similar articles

Cited by

References

    1. Andersen, J. B., C. Sternberg, L. K. Poulsen, S. P. Bjorn, M. Givskov, and S. Molin. 1998. New unstable variants of green fluorescent protein for studies of transient gene expression in bacteria. Appl. Environ. Microbiol. 64:2240-2246. - PMC - PubMed
    1. Beenken, K. E., J. S. Blevins, and M. S. Smeltzer. 2003. Mutation of sarA in Staphylococcus aureus limits biofilm formation. Infect. Immun. 71:4206-4211. - PMC - PubMed
    1. Blevins, J. S., M. O. Elasri, S. D. Allmendinger, K. E. Beenken, R. A. Skinner, J. R. Thomas, and M. S. Smeltzer. 2003. Role of sarA in the pathogenesis of Staphylococcus aureus musculoskeletal infection. Infect. Immun. 71:516-523. - PMC - PubMed
    1. Caiazza, N. C., and G. A. O'Toole. 2003. Alpha-toxin is required for biofilm formation by Staphylococcus aureus. J. Bacteriol. 185:3214-3217. - PMC - PubMed
    1. Ceri, H., M. E. Olson, C. Stremick, R. R. Read, D. Morck, and A. Buret. 1999. The Calgary Biofilm Device: new technology for rapid determination of antibiotic susceptibilities of bacterial biofilms. J. Clin. Microbiol. 37:1771-1776. - PMC - PubMed

Publication types

MeSH terms

LinkOut - more resources