Activation of c-Jun N-terminal kinase 1 and caspase 3 in the tamoxifen-induced apoptosis of rat glioma cells
- PMID: 14997384
- PMCID: PMC12161849
- DOI: 10.1007/s00432-004-0546-y
Activation of c-Jun N-terminal kinase 1 and caspase 3 in the tamoxifen-induced apoptosis of rat glioma cells
Abstract
Purpose: The mechanisms of the antitumor effects of tamoxifen upon gliomas are still unclear. In this study, we investigated the role of c-Jun N-terminal kinase-1 (JNK1) and caspase 3 in the tamoxifen-induced apoptosis of rat glioma cells.
Methods: Glioma cells were treated with tamoxifen, followed by a cytotoxicity assay to study its effects on the cells, and then a flow-activated cell sorter (FACS) analysis was performed to analyze the cellular apoptosis of the glioma cells. The expression of JNK1 and phospho-specific JNK1 in glioma cells treated with tamoxifen was investigated by Western blot analysis. The activity of caspase 3 in glioma cells was analyzed by caspase activity assay.
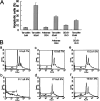
Results: Tamoxifen was demonstrated to exert cytotoxic effects upon and induced apoptosis of the glioma cells in a concentration- and time-dependent manner (P<0.05). Western blot analysis demonstrated that tamoxifen increased the expression of phospho-specific JNK1 in glioma cells, and an increasing concentration of tamoxifen induced an increasing expression of phospho-specific JNK1. Four-hour 50-microM tamoxifen treatment increased the expression of phospho-specific JNK1 to 3.2 times that of the control level in glioma cells. Tamoxifen also increased the activity of caspase 3 in glioma cells. Pretreatment of glioma cells with the antisense oligonucleotide (OGN) of JNK1 immediately prior to tamoxifen treatment suppressed the expression of phospho-specific JNK1 and the activity of caspase 3. The apoptosis fraction of glioma cells induced by 4-h treatment with 50 microM tamoxifen was decreased from 51% to 28% by pretreatment with the antisense OGN of JNK1 (P<0.003), and to 20% by pretreatment with caspase 3 inhibitor (DEVD-CHO) (P<0.0008).
Conclusions: The results suggest that the tamoxifen-induced apoptosis of rat glioma cells is related to the activation of the JNK1/caspase 3 signaling pathway; however, the confirmation of the occurrence of such activation in vivo needs further investigation.
Copyright 2004 Springer-Verlag
Figures


Similar articles
-
Macrophages resistant to endogenously generated nitric oxide-mediated apoptosis are hypersensitive to exogenously added nitric oxide donors: dichotomous apoptotic response independent of caspase 3 and reversal by the mitogen-activated protein kinase kinase (MEK) inhibitor PD 098059.Proc Natl Acad Sci U S A. 1998 Apr 28;95(9):5045-50. doi: 10.1073/pnas.95.9.5045. Proc Natl Acad Sci U S A. 1998. PMID: 9560225 Free PMC article.
-
Suppression of MMP-2 attenuates TNF-α induced NF-κB activation and leads to JNK mediated cell death in glioma.PLoS One. 2011 May 4;6(5):e19341. doi: 10.1371/journal.pone.0019341. PLoS One. 2011. Retraction in: PLoS One. 2025 Jul 11;20(7):e0328090. doi: 10.1371/journal.pone.0328090. PMID: 21573233 Free PMC article. Retracted.
-
Cord blood stem cell-mediated induction of apoptosis in glioma downregulates X-linked inhibitor of apoptosis protein (XIAP).PLoS One. 2010 Jul 28;5(7):e11813. doi: 10.1371/journal.pone.0011813. PLoS One. 2010. Retraction in: PLoS One. 2025 Jul 11;20(7):e0327907. doi: 10.1371/journal.pone.0327907. PMID: 20676365 Free PMC article. Retracted.
-
The effectiveness and cost-effectiveness of carmustine implants and temozolomide for the treatment of newly diagnosed high-grade glioma: a systematic review and economic evaluation.Health Technol Assess. 2007 Nov;11(45):iii-iv, ix-221. doi: 10.3310/hta11450. Health Technol Assess. 2007. PMID: 17999840
-
LHRH agonists for adjuvant therapy of early breast cancer in premenopausal women.Cochrane Database Syst Rev. 2009 Oct 7;2009(4):CD004562. doi: 10.1002/14651858.CD004562.pub4. Cochrane Database Syst Rev. 2009. PMID: 19821328 Free PMC article.
Cited by
-
Apoptosis of human carcinoma cells in the presence of potential anti-cancer drugs: III. Treatment of Colo-205 and SKBR3 cells with: cis -platin, Tamoxifen, Melphalan, Betulinic acid, L-PDMP, L-PPMP, and GD3 ganglioside.Glycoconj J. 2004;20(9):563-77. doi: 10.1023/B:GLYC.0000043293.46845.07. Glycoconj J. 2004. PMID: 15454695
-
Differences in gene expression profiles and signaling pathways in rhabdomyolysis-induced acute kidney injury.Int J Clin Exp Pathol. 2015 Nov 1;8(11):14087-98. eCollection 2015. Int J Clin Exp Pathol. 2015. PMID: 26823722 Free PMC article.
-
Ion Channels as Therapeutic Targets in High Grade Gliomas.Cancers (Basel). 2020 Oct 21;12(10):3068. doi: 10.3390/cancers12103068. Cancers (Basel). 2020. PMID: 33096667 Free PMC article. Review.
-
The role of PKN1 in glioma pathogenesis and the antiglioma effect of raloxifene targeting PKN1.J Cell Mol Med. 2023 Sep;27(18):2730-2743. doi: 10.1111/jcmm.17860. Epub 2023 Jul 21. J Cell Mol Med. 2023. PMID: 37480215 Free PMC article.
-
Inhibition of PTTG1 expression by microRNA suppresses proliferation and induces apoptosis of malignant glioma cells.Oncol Lett. 2016 Nov;12(5):3463-3471. doi: 10.3892/ol.2016.5035. Epub 2016 Aug 22. Oncol Lett. 2016. PMID: 27900021 Free PMC article.
References
-
- Baltuch GH, Gouldwell WT, Villemure JG, Yong VW (1993) Protein kinase C inhibitors suppress cell growth in established and low-passage glioma cell lines. A comparison between staurosporine and tamoxifen. Neurosurgery 33:495–501 - PubMed
-
- Chen CY, Tan TH (2000) The c-Jun N-terminal kinase pathway and apoptotic signaling. Int J Oncol 16:651–662 - PubMed
-
- Chen H, Tritton TR, Kenny N, Absher M, Chiu JF (1996) Tamoxifen induces TGF-β1 activity and apoptosis of human MCF-7 breast cancer cells in vitro. J Cell Biochem 61:9–17 - PubMed
-
- Chen YR, Wang W, Kong AN, Tan TH (1998) Molecular mechanisms of c-Jun N-terminal kinase-mediated apoptosis induced by anticarcinogenic isothiocyanates. J Biol Chem 273:1769–1775 - PubMed
Publication types
MeSH terms
Substances
LinkOut - more resources
Full Text Sources
Molecular Biology Databases
Research Materials
Miscellaneous

