. 2004 Apr;74(4):637-46.
doi: 10.1086/383092. Epub 2004 Mar 2.

Natural selection and molecular evolution in PTC, a bitter-taste receptor gene

Affiliations

Natural selection and molecular evolution in PTC, a bitter-taste receptor gene

Stephen Wooding et al. Am J Hum Genet. 2004 Apr.

Abstract

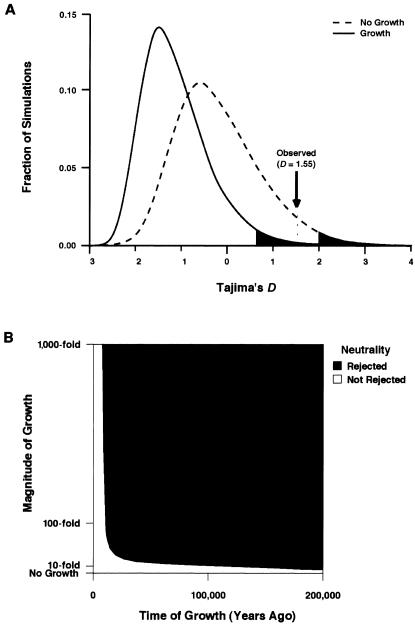
The ability to taste phenylthiocarbamide (PTC) is a classic phenotype that has long been known to vary in human populations. This phenotype is of genetic, epidemiologic, and evolutionary interest because the ability to taste PTC is correlated with the ability to taste other bitter substances, many of which are toxic. Thus, variation in PTC perception may reflect variation in dietary preferences throughout human history and could correlate with susceptibility to diet-related diseases in modern populations. To test R. A. Fisher's long-standing hypothesis that variability in PTC perception has been maintained by balancing natural selection, we examined patterns of DNA sequence variation in the recently identified PTC gene, which accounts for up to 85% of phenotypic variance in the trait. We analyzed the entire coding region of PTC (1,002 bp) in a sample of 330 chromosomes collected from African (n=62), Asian (n=138), European (n=110), and North American (n=20) populations by use of new statistical tests for natural selection that take into account the potentially confounding effects of human population growth. Two intermediate-frequency haplotypes corresponding to "taster" and "nontaster" phenotypes were found. These haplotypes had similar frequencies across Africa, Asia, and Europe. Genetic differentiation between the continental population samples was low (FST=0.056) in comparison with estimates based on other genes. In addition, Tajima's D and Fu and Li's D and F statistics demonstrated a significant deviation from neutrality because of an excess of intermediate-frequency variants when human population growth was taken into account (P<.01). These results combine to suggest that balancing natural selection has acted to maintain "taster" and "nontaster" alleles at the PTC locus in humans.


Figures

Figure  1
Figure 1
Frequency of PTC “nontaster” allele, estimated from 348 populations described by Guo and Reed (2001) under the assumption that the inability to taste PTC is attributable to the recessive allele in a one-locus, two-allele system.
Figure  2
Figure 2
Variable nucleotide positions in PTC haplotypes. Each haplotype is summarized in two rows. The top row summarizes nucleotide variation in the haplotype, and the bottom row summarizes amino acid variation in the haplotype. Each column represents a codon containing a variable nucleotide position, indicated at the top of the column. The number of occurrences of each haplotype is indicated to the right for the African (Af), Asian (As), European (Eu), and North American (NA) samples. Haplotype counts are not given for the chimpanzee and gorilla haplotypes (ptA and ggA, respectively), which were each observed twice. Shaded columns indicate the three variable amino acid positions used for haplotype designation by Kim et al. (2003).
Figure  3
Figure 3
Minimum spanning tree of relationships between PTC gene haplotypes and haplotype frequencies. A, Each circle represents a haplotype, and the size of each circle represents the haplotype’s relative frequency. Within each circle, shading indicates the fraction of observations in the population indicated. Each connection between haplotypes corresponds to one nucleotide substitution, except where indicated by parentheses. For example, haplotype A differs from haplotype E by one nucleotide, but it differs from the chimpanzee haplotype by six nucleotides. Differences between haplotypes can be determined from figure 2. The three-letter codes above the network diagram indicate the haplotype designation used by Kim et al. (2003). B, Haplotype frequencies in each sample.
Figure  4
Figure 4
Tests of the DT statistic. A, Comparison of the probability distribution of the DT statistic under the assumption that human population sizes have been constant and under the assumption that, 100,000 years ago, human population sizes increased 100-fold. Shaded areas are upper 2.5% confidence limits. B, Tests under varying population history parameters. Blue areas indicate parameters under which the hypothesis of neutrality was rejected (P<.025). Yellow areas indicate parameters under which the hypothesis of neutrality was not rejected.

References

Electronic-Database Information

    1. Online Mendelian Inheritance in Man (OMIM), http://www.ncbi.nlm.nih.gov/Omim/ (for PTC) - PubMed

References

    1. Akey JM, Zhang G, Zhang K, Jin L, Shriver MD (2002) Interrogating a high-density SNP map for signatures of natural selection. Genome Res 12:1805–181410.1101/gr.631202 - DOI - PMC - PubMed
    1. Anonymous (1931) Tasteblindness. Science Suppl 73:14
    1. Bamshad M, Wooding S (2003) Signatures of natural selection in the human genome. Nat Rev Genet 4:99–11110.1038/nrg999 - DOI - PubMed
    1. Barnicot NA, Harris H, Kalmus H (1951) Taste thresholds of further eighteen compounds and their correlation with PTC thresholds. Ann Eugen 16:119–128 - PubMed
    1. Bartoshuk LM, Duffy VB, Miller IJ (1994) PTC/PROP tasting: anatomy, psychophysics, and sex effects. Physiol Behav 56:1165–117110.1016/0031-9384(94)90361-1 - DOI - PubMed

Publication types

Associated data