. 2004 Feb;5(2):163-75.
doi: 10.1016/s1535-6108(04)00020-0.

Human MUC1 carcinoma-associated protein confers resistance to genotoxic anticancer agents

Affiliations

Human MUC1 carcinoma-associated protein confers resistance to genotoxic anticancer agents

Jian Ren et al. Cancer Cell. 2004 Feb.

Abstract

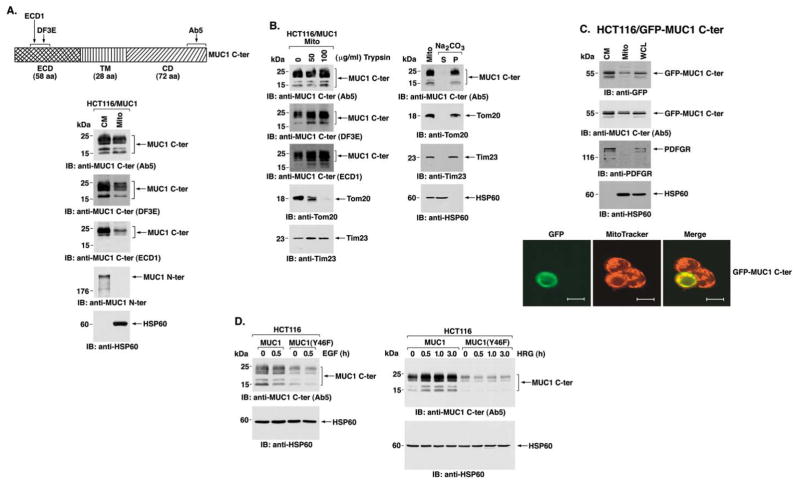
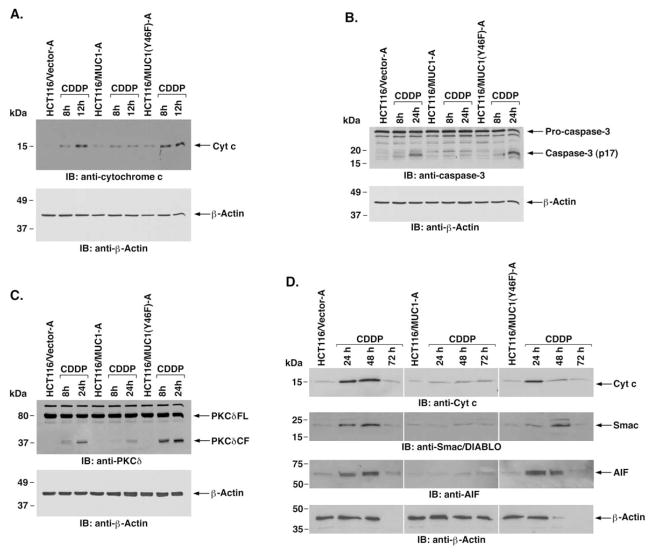
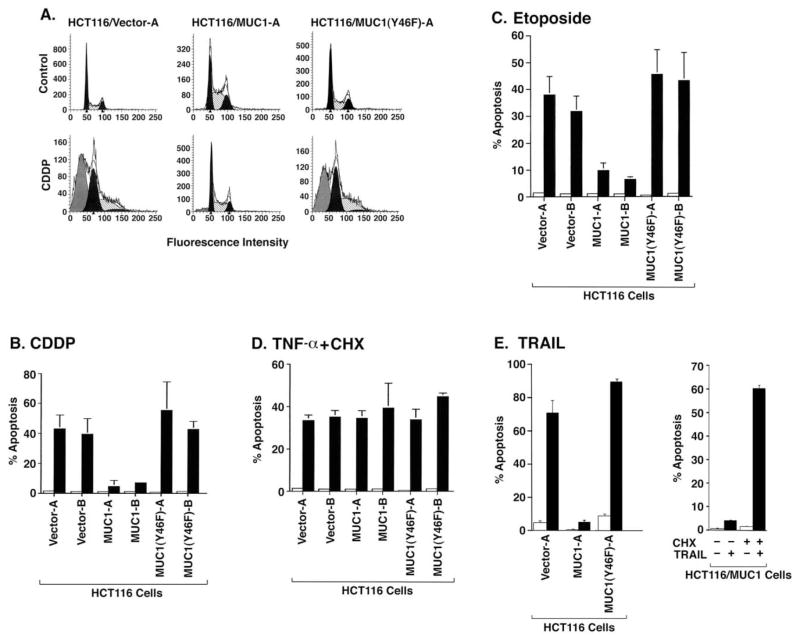
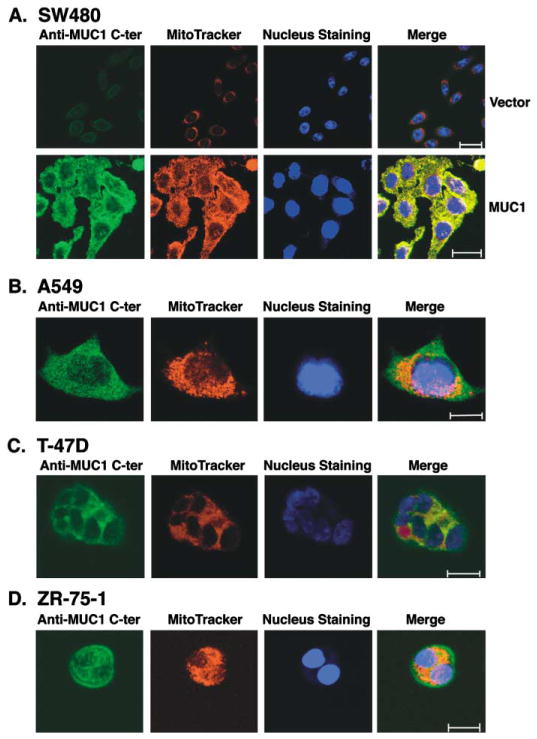
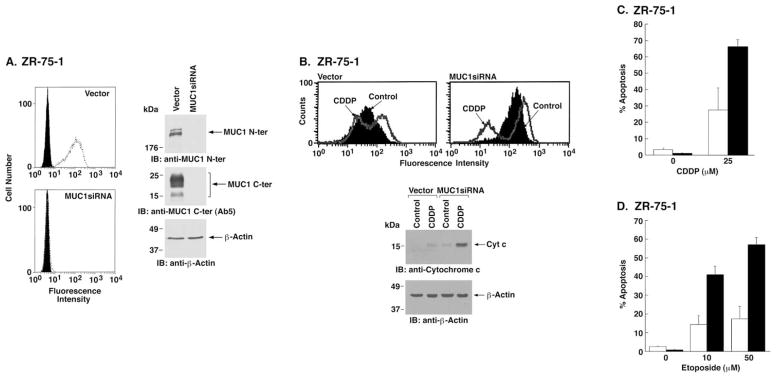
The MUC1 transforming protein is overexpressed by most human carcinomas. The present studies demonstrate that the MUC1 C-terminal subunit (MUC1 C-ter) localizes to mitochondria in HCT116/MUC1 colon carcinoma cells and that heregulin stimulates mitochondrial targeting of MUC1 C-ter. We also show that MUC1 attenuates cisplatin-induced (1) release of mitochondrial apoptogenic factors, (2) activation of caspase-3, and (3) induction of apoptosis. Moreover, knockdown of MUC1 expression in A549 lung and ZR-75-1 breast carcinoma cells by MUC1siRNA was associated with increased sensitivity to genotoxic drugs in vitro and in vivo. These findings indicate that MUC1 attenuates the apoptotic response to DNA damage and that this oncoprotein confers resistance to genotoxic anticancer agents.


Figures

Figure 1
Figure 1. MUC1 C-ter localizes to mitochondria
HCT116 cells were transfected to stably express the empty vector, MUC1, or MUC1(Y46F). Clones (A and B) were selected from two independent transfections. A: Lysates were subjected to immunoblot analysis with anti-MUC1 N-ter (DF3), anti-MUC1 C-ter (Ab5), and anti-β-actin. B: Cells were incubated with anti-MUC1 N-ter (open patterns) or control mouse IgG (closed patterns) and analyzed for immunofluorescence by flow cytometry. C: Confocal microscopy of HCT116/Vector-A, HCT116/MUC1-A, and HCT116/MUC1(Y46F)-A cells stained with anti-MUC1 N-ter (DF3) or C-ter (Ab5). Mitochondria were stained with MitoTracker Red. Nuclei were stained with TO-PRO-3. Scale bars represent 20 μm in the upper three panels and 10 μm in the lower panel. D: Higher magnification of an HCT116/MUC1-A cell stained with anti-MUC1 C-ter (Ab5), Mitotracker Red CMXRos, and TO-PRO-3. Confocal images were focused on cell membrane (upper panels) and mitochondrial (lower panels) staining with anti-MUC1 C-ter. Scale bars represent 10 μm. E: Mitochondrial fractions from HCT116/vector-A, HCT116/MUC1-A, and HCT116/MUC1(Y46F)-A cells were subjected to SDS-PAGE and immunoblotting with the indicated antibodies. Whole-cell lysate (WCL) was included as a control for detection of the membrane-associated MUC1 N-ter, cytoplasmic IκBα, nuclear PCNA, and endoplasmic reticulum-associated calreticulin proteins.
Figure 2
Figure 2. HRG stimulation targets MUC1 C-ter to mitochondria
A: Schematic representation of MUC1 C-ter with sites recognized by the indicated antibodies (upper panel). Lysates from the cell membrane (CM) and mitochondrial (Mito) fractions of HCT116/MUC1-A cells were subjected to SDS-PAGE and immunoblot analysis with the indicated antibodies (lower panels). B: Purified mitochondria (0.4 mg protein/ml) were treated with 0, 50, or 100 μg/ml trypsin for 20 min at 4°C (left). The samples were subjected to immunoblot analysis with the indicated antibodies. Purified mitochondria (0.4 mg protein/ml) were resuspended in 0.1 M Na2CO3 (pH 11.5), incubated for 30 min at 0°C, and then centrifuged at 100,000 × μg for 30 min at 4°C (right). The supernatant (S) and pellet (P) were analyzed by immunoblotting with the indicated antibodies. C: HCT116 cells were transiently transfected with MUC1 C-ter tagged at the N terminus with GFP (GFP-MUC1 C-ter) and harvested at 36 hr. Lysates from cell membrane (CM) and mitochondrial (Mito) fractions were subjected to immunoblot analysis with the indicated antibodies (left). Whole-cell lysate (WCL) was included as a control. Confocal microscopy was performed on the transfected HCT116 cells after staining with MitoTracker Red and TO-PRO-3. Scale bars represent 10 μm. D: HCT116/MUC1 and HCT116/MUC1(Y46F) cells were stimulated with EGF for 30 min (left) or HRG for the indicated times (right). Mitochondrial lysates were subjected to immunoblot analysis with anti-MUC1 C-ter and anti-HSP60. Intensity of the signals was determined by densitometric scanning.
Figure 3
Figure 3. MUC1 attenuates CDDP-induced activation of the intrinsic mitochondrial apoptotic pathway
A: The indicated cells were treated with 100 μM CDDP for 8 and 12 hr. Cytosolic lysates were analyzed by immunoblotting with anti-cytochrome c and anti-β-actin. B and C: The indicated cells were treated with 100 μM CDDP for 8 and 24 hr. Cell lysates were analyzed by immunoblotting with anti-caspase-3 (B) or anti-PKCδ(C) and anti-β-actin. D: The indicated cells were treated with 100 μM CDDP for 24, 48, and 72 hr. Cytosolic lysates were analyzed by immunoblotting with the indicated antibodies.
Figure 4
Figure 4. MUC1 attenuates DNA damage- and TRAIL-induced apoptosis
A: The indicated cells were treated with 100 μM CDDP for 24 hr and then analyzed for sub-G1 DNA. B: Clones A and B of the indicated cells were left untreated (open bars) or treated with 100 μM CDDP for 24 hr (solid bars). C: Clones A and B of the indicated cells were left untreated (open bars) or treated with 70 μM etoposide for 48 hr (solid bars). D: Clones A and B of the indicated cells were left untreated (open bars) or treated with 20 ng/ml TNF-α and 10 μg/ml CHX for 12 hr (closed bars). The results are presented as the percentage apoptosis (mean ± SD of three independent experiments) as determined by analysis of sub-G1 DNA. E: The indicated cells were left untreated (open bars) or treated with 100 ng/ml TRAIL for 14 hr (closed bars) (left). HCT116/MUC1 cells were treated with 100 ng/ml TRAIL and/or 10 μg/ml CHX as indicated for 14 hr (right). The results are presented as the percentage apoptosis (mean ± SD of three experiments) as determined by analysis of sub-G1 DNA.
Figure 5
Figure 5. MUC1 C-ter localizes to mitochondria of diverse carcinoma cells
A: SW480 carcinoma cells stably transfected to express an empty vector or MUC1 were incubated with anti-MUC1 C-ter and then a FITC-conjugated secondary antibody. Mitochondria were stained with MitoTracker Red. Nuclei were stained with TO-PRO-3. Scale bars represent 20 μm. B–D: A549 lung (B), T-47D breast (C), and ZR-75-1 breast (D) carcinoma cells were analyzed by staining with anti-MUC1 C-ter, MitoTracker Red, and TO-PRO-3. Scale bars represent 10 μm (B) or 20 μm (C and D).
Figure 6
Figure 6. Transient downregulation of MUC1 expression sensitizes A549 carcinoma cells to CDDP-induced apoptosis
A: A549 cells were treated with CsiRNA or MUC1siRNA and harvested 72 hr after transfection. Lysates were analyzed by immunoblotting with anti-MUC1 N-ter and anti-β-actin. B: A549 cells were left untransfected (MOCK) or transfected with MUC1siRNA or CsiRNA, incubated for 72 hr, and then treated with 10 μM of CDDP for 48 hr. Cells were stained with FITC-conjugated annexin V and analyzed by flow cytometry. C: The results for MOCK (open bars), MUC1siRNA transfected (solid bars), or CsiRNA transfected (hatched bars) cells are expressed as the percentage apoptosis (mean ± SD of three independent experiments).
Figure 7
Figure 7. Stable downregulation of MUC1 sensitizes ZR-75-1 cells to CDDP- and etoposide-induced apoptosis
A: ZR-75-1 cells were infected with a control retroviral vector or one expressing MUC1siRNA. Stable transfectants were selected in the presence of G418. Cells were incubated with anti-MUC1 N-ter (open patterns) or control mouse IgG (closed patterns) and analyzed for immunofluorescence by flow cytometry (left). Lysates were analyzed by immunoblotting with the indicated antibodies (right panels). B: ZR-75-1/vector and ZR-75-1/MUC1siRNA cells were incubated with DiOC6[3] and then left untreated (Control) or exposed to 25 μM CDDP for 48 hr. Mitochondrial transmembrane potential was assessed by flow cytometry (upper panels). Cytosolic lysates were analyzed by immunoblotting with the indicated antibodies (lower panels). C and D: ZR-75-1/vector (open bars) and ZR-75-1/MUC1siRNA (solid bars) cells were treated with 25 μM CDDP for 72 hr (C) or with 10 and 50 μM etoposide for 72 hr (D). Cells were analyzed for sub-G1 DNA. The results are presented as the percentage apoptosis (mean ± SD of three independent experiments).
Figure 8
Figure 8. MUC1 confers resistance to CDDP treatment in vivo
A: HCT116/vector (○, ●) or HCT116/MUC1 (□, ■) cells (1 × 10⁶) were injected subcutaneously into the posterior flanks of nude mice. B: ZR-75-1/vector (○, ●) or ZR-75-1/MUC1siRNA (○, ●) cells (1 × 10⁷) were injected into nude mice that had been pretreated with β-estradiol. The mice were treated as indicated (arrows) with intraperitoneal injections of PBS (□, ○) or 7 mg/kg CDDP (■, ●). Tumor volumes were calculated from bidimensional measurements at the indicated times. The results are expressed as the tumor volume (mean ± SD) of 4–8 mice per group.

Comment in

References

    1. Arnoult D, Gaume B, Karbowski M, Sharpe JC, Cecconi F, Youle RJ. Mitochondrial release of AIF and EndoG requires caspase activation downstream of Bax/Bak-mediated permeabilization. EMBO J. 2003;22:4385–4399. - PMC - PubMed
    1. Belsches-Jablonski AP, Biscardi JS, Peavy DR, Tice DA, Romney DA, Parsons SJ. Src family kinases and HER2 interactions in human breast cancer cell growth and survival. Oncogene. 2001;20:1465–1475. - PubMed
    1. Boldin M, Goncharov T, Goltsev Y, Wallach D. Involvement of MACH, a novel MORT1/FADD-interacting protease, in Fas/APO-1- and TNF receptor-induced cell-death. Cell. 1996;85:803–815. - PubMed
    1. Bunz F. Cell death and cancer therapy. Curr Opin Pharmacol. 2001;1:337–341. - PubMed
    1. Datta R, Manome Y, Taneja N, Boise LH, Weichselbaum RR, Thompson CB, Slapak CA, Kufe DW. Overexpression of Bcl-xL by cytotoxic drug exposure confers resistance to ionizing radiation-induced internucleosomal DNA fragmentation. Cell Growth Differ. 1995;6:363–370. - PubMed

Publication types

MeSH terms