. 2004 Mar 3;24(9):2143-55.
doi: 10.1523/JNEUROSCI.3547-03.2004.

Reactive astrocytes protect tissue and preserve function after spinal cord injury

Affiliations

Reactive astrocytes protect tissue and preserve function after spinal cord injury

Jill R Faulkner et al. J Neurosci. .

Abstract

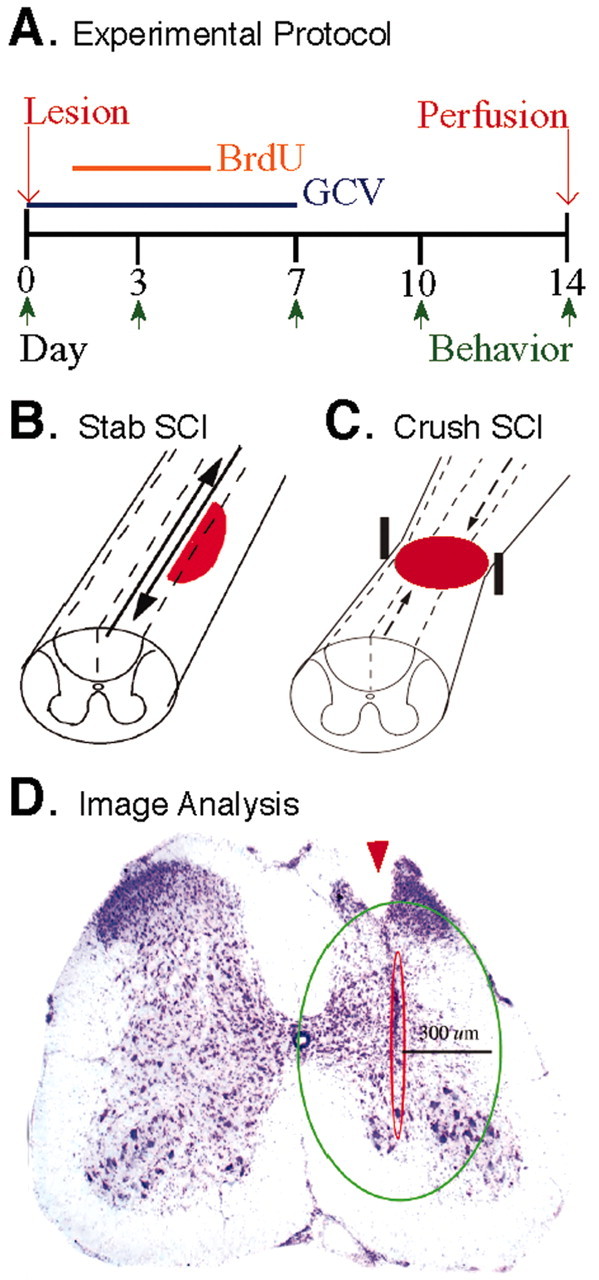
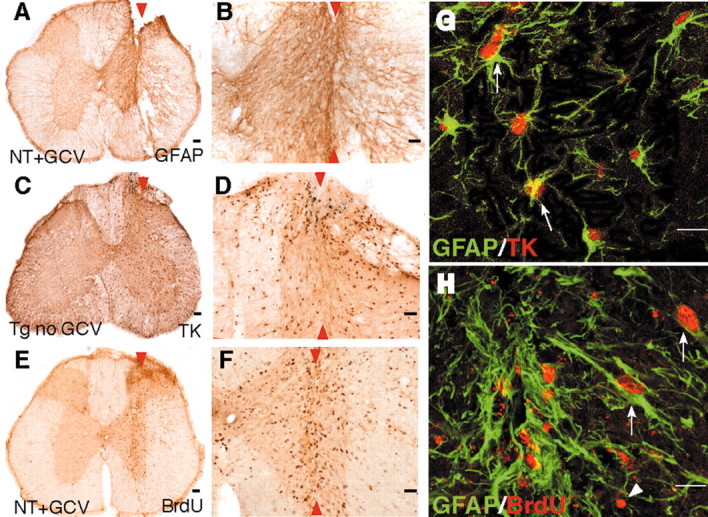
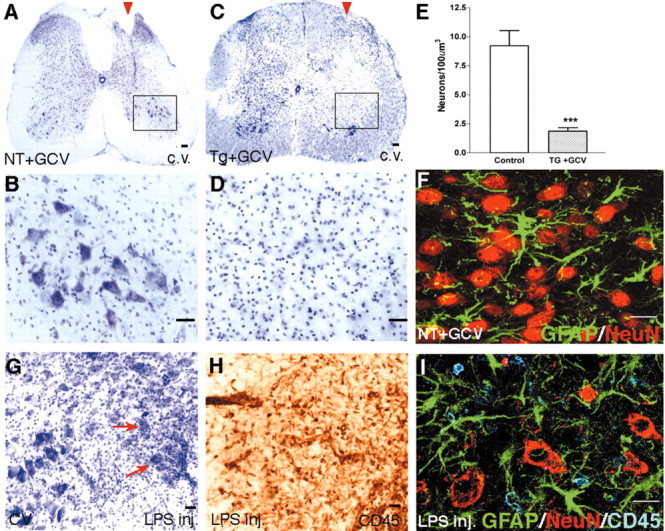
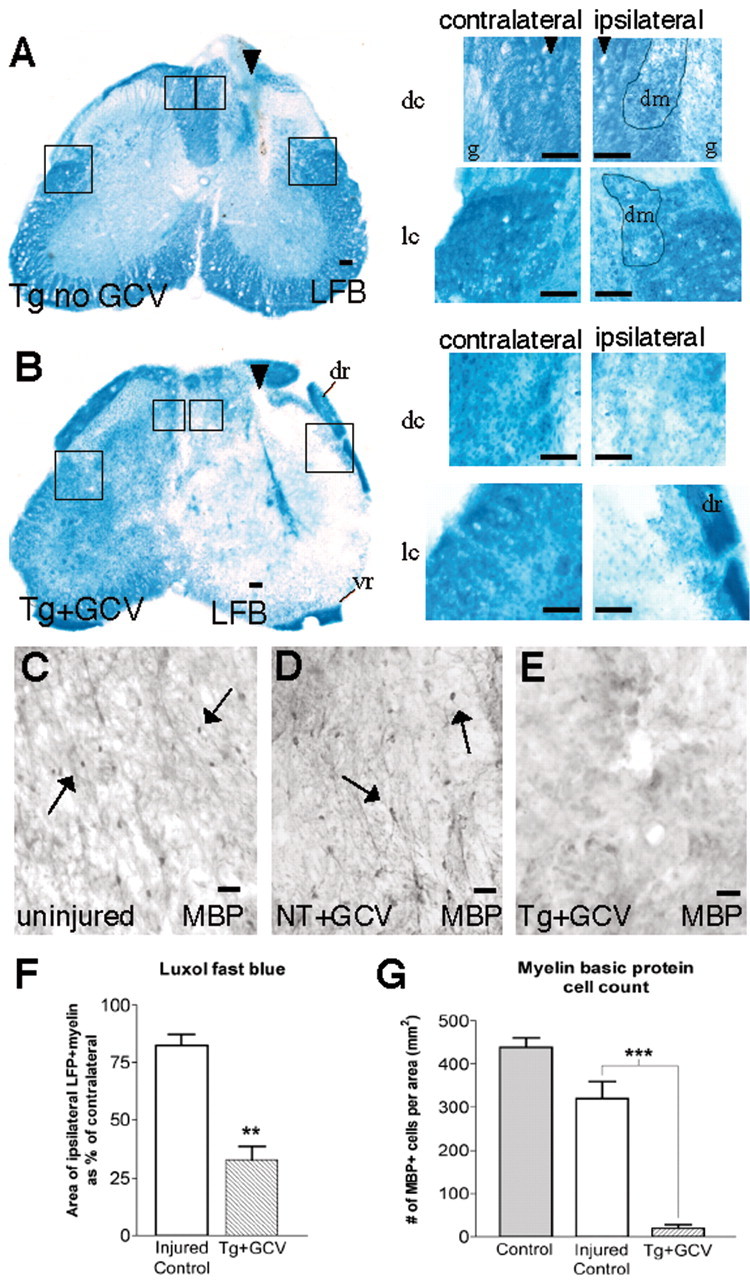
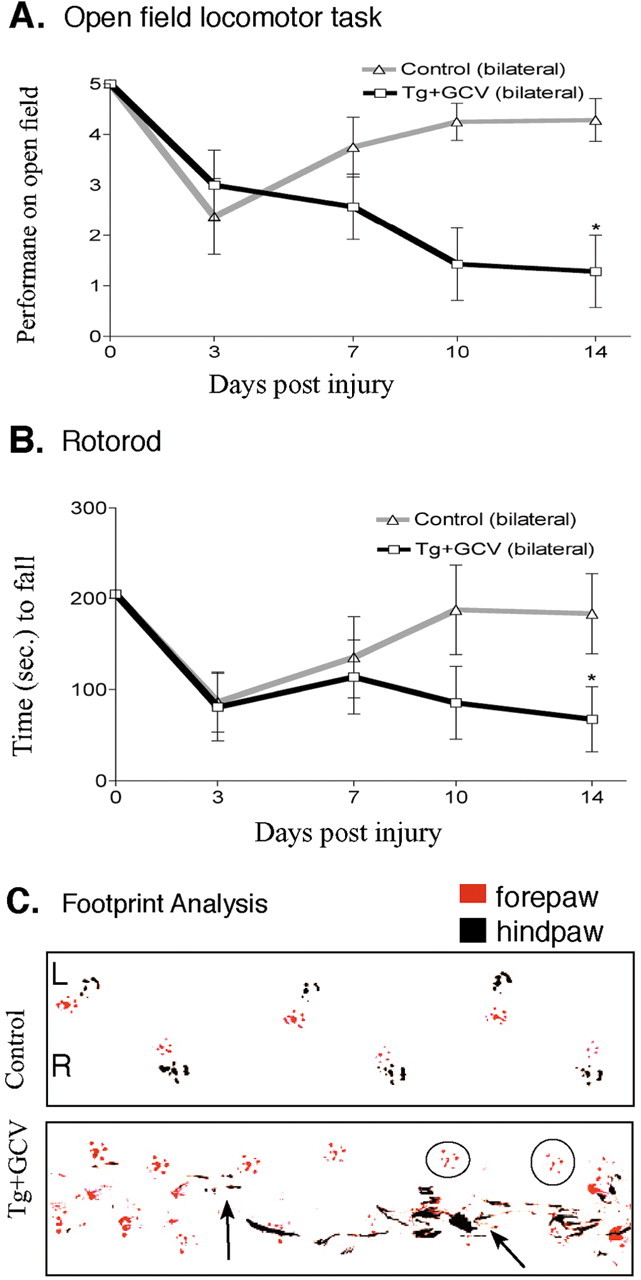
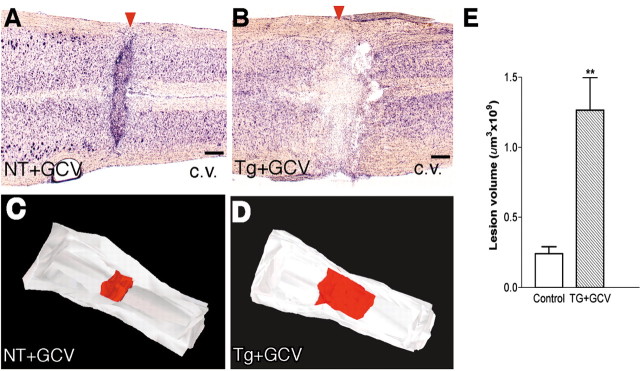
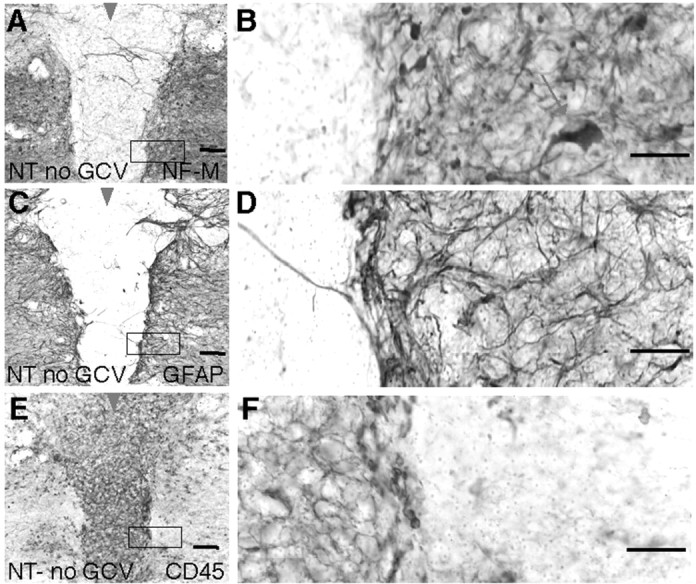
Reactive astrocytes are prominent in the cellular response to spinal cord injury (SCI), but their roles are not well understood. We used a transgenic mouse model to study the consequences of selective and conditional ablation of reactive astrocytes after stab or crush SCI. Mice expressing a glial fibrillary acid protein-herpes simplex virus-thymidine kinase transgene were given mild or moderate SCI and treated with the antiviral agent ganciclovir (GCV) to ablate dividing, reactive, transgene-expressing astrocytes in the immediate vicinity of the SCI. Small stab injuries in control mice caused little tissue disruption, little demyelination, no obvious neuronal death, and mild, reversible functional impairments. Equivalent small stab injuries in transgenic mice given GCV to ablate reactive astrocytes caused failure of blood-brain barrier repair, leukocyte infiltration, local tissue disruption, severe demyelination, neuronal and oligodendrocyte death, and pronounced motor deficits. Moderate crush injuries in control mice caused focal tissue disruption and cellular degeneration, with moderate, primarily reversible motor impairments. Equivalent moderate crush injuries combined with ablation of reactive astrocytes caused widespread tissue disruption, pronounced cellular degeneration, and failure of wound contraction, with severe persisting motor deficits. These findings show that reactive astrocytes provide essential activities that protect tissue and preserve function after mild or moderate SCI. In nontransgenic animals, crush or contusion SCIs routinely exhibit regions of degenerated tissue that are devoid of astrocytes. Our findings suggest that identifying ways to preserve reactive astrocytes, to augment their protective functions, or both, may lead to novel approaches to reducing secondary tissue degeneration and improving functional outcome after SCI.


Figures

Figure 1.
Figure 1.
A, Experimental protocol showing time lines of postoperative delivery of GCV and BrdU and time points of behavioral analysis and perfusion fixation. B, C, Schematic illustrations of different SCI models at L1-L2. B, Longitudinal stab SCI was made primarily through gray matter parallel to major ascending and descending long axon tracts. C, Moderate crush SCI was made by compression from both lateral sides using forceps with a 0.5 mm spacer and affected gray matter as well as major ascending and descending long axon tracts. D, Photomicrograph showing tissue area adjacent to stab SCI (arrowhead) used for morphometric analysis as traced using interactive software and a computer-guided microscope stage. Scale bar, 300 μm.
Figure 2.
Figure 2.
Expression of GFAP and transgene-derived TK by dividing reactive astrocytes adjacent to stab SCI in control mice. A-H, Transverse sections of upper lumbar spinal cord after longitudinal stab SCI (arrowheads) in either nontransgenic mice given GCV (A, B, E, F, H; NT+GCV) or GFAP-TK transgenic mice not given GCV (C, D, G; Tg no GCV). B, D, F, Details, respectively, of A, C, and E. A-F, Single immunohistochemical staining for GFAP (A, B), TK (C, D), or BrdU (E, F) viewed by bright-field microscopy. G, H, Double immunohistochemical staining for GFAP and TK (G) or GFAP and BrdU (H) viewed by laser-scanning confocal microscopy. Staining for GFAP is prominent in astrocyte processes and rare in cell bodies (A, B, G), whereas staining for TK is prominent in astrocyte cell bodies and rare in cell processes (C, D, G). After stab SCI, astrocytes along the wound margin hypertrophy and upregulate their expression of both GFAP (A, B, G) and TK (C, D, G). GCV had no effect on astrocyte scar formation in nontransgenic mice (A, B, E, F). Double staining and analysis using laser-scanning confocal microscopy reveal that TK staining is found only in GFAP-positive astrocytes (G, arrows). Many cells along the wound margin divide and take up BrdU (E, F). Many of these dividing BrdU-labeled cells are GFAP-positive reactive astrocytes (H, arrows); others are not (G, arrowheads). Scale bars: A, C, E, 100 μm; B, D, F, 50 μm; G, H, 15 μm.
Figure 3.
Figure 3.
Transgenically targeted ablation of reactive scar-forming astrocytes adjacent to stab SCI. A-G, J, I, Transverse sections of upper lumbar spinal cord after longitudinal stab SCI (arrowheads) in nontransgenic mice given GCV (A, E; NT+GCV), a GFAP-TK transgenic mouse not given GCV (C; Tg no GCV), or GFAP-TK transgenic mice given GCV (B, D, F, G, J, I; Tg+GCV). A-F, Single immunohistochemical staining for GFAP (A, B), TK (C, D), or BrdU (E, F) viewed by bright-field microscopy. G, I, J, Double immunohistochemical staining for GFAP and BrdU (G) or CD45 and BrdU (I, J) viewed by laser-scanning confocal microscopy. After stab SCI in control mice (A, C, E), astrocytes along the wound margin hypertrophy, upregulate their expression of GFAP (A) and TK (C), and take up BrdU. After stab SCI in transgenic mice given GCV for 7 d (B, D, F), GFAP- and TK-expressing astrocytes (B, D) and BrdU-labeled dividing cells (F) are substantially depleted from a large area around the center of the stab wound. Within this area, only GFAP-positive fragments of astrocytes remain (B, G, arrows). Astrocytes at the borders of this area have upregulated GFAP or TK during the 7 d after GCV delivery (B, D). Some dividing cells are present in the area depleted of astrocytes (F); all of these cells were GFAP-negative (G, arrowheads), and most were positive for the inflammatory cell marker CD45 (I, J). H, Graph showing mean ± SEM number of TK-positive cells within the 300 μm wound margin adjacent to the stab injury (see Fig. 1 D) in GFAP-TK transgenic mice not given GCV (Tg-GCV) or given GCV (Tg+GCV); n = 4 per group. **Significantly different from control, p < 0.01 (t test). Scale bars: A-F, 100 μm; G, 15 μm; J, 10 μm; I, 5 μm.
Figure 4.
Figure 4.
Failure of blood-brain barrier repair after ablation of reactive astrocytes adjacent to stab SCI. A-D, Transverse sections of upper lumbar spinal cord after longitudinal stab SCI (arrowheads) in GFAP-TK transgenic mice not given GCV (A, C; Tg no GCV) or GFAP-TK transgenic mice given GCV (B, D; Tg+GCV). A, B, Immunohistochemical staining for IgG viewed by bright-field microscopy. C, D, Fluorescence microscopy of Alexa 488-tagged dextran (molecular weight, 70,000). At 14 d after stab SCI in control mice, IgG and dextran are excluded from parenchyma adjacent to the injury, indicating that the blood-brain barrier has repaired as expected (A, C); similar results were obtained in n = 5 mice. At 14 d after stab SCI in GFAP-TK mice given GCV, IgG and dextran continue to enter neural parenchyma, indicating that the blood-brain barrier has failed to repair in the absence of reactive astrocytes (B,D); similar results were obtained in n = 5 mice. Scale bars, 100 μm.
Figure 5.
Figure 5.
Increased leukocyte infiltration after ablation of reactive astrocytes adjacent to stab SCI. A-F, L, Transverse sections of upper lumbar spinal cord 14 d after longitudinal stab SCI (arrowheads) in a nontransgenic mouse not given GCV (A, B, E; NT no GCV) or in a GFAP-TK transgenic mouse given GCV (C, D, F, L; Tg+GCV). A-F, Immunohistochemical staining for the leukocyte marker CD45 viewed by bright-field microscopy. B, D, Details, respectively, of boxed areas in A and C. E, F, Details, respectively, of B and D showing CD45-positive cells with the typical appearance of microglia (E) and activated macrophages (F). In the control mouse, there is moderate microglial activation (arrow) but few intensely stained CD45-positive cells with round cell bodies typical of leukocytes in the neural parenchyma adjacent to the injury (A, B, E). In the GFAP-TK transgenic mouse given GCV, the region of astrocyte ablation is densely packed with many intensely stained CD45-positive cells with rounded cell bodies typical of leukocytes, in particular, activated macrophages (C, D, F). G, Mean cell number ± SEM of CD45-immunoreactive cells within the wound margin adjacent to the stab injury (see Fig. 1D); GFAP-TK mice given GCV exhibit a sevenfold greater number compared with control mice; n = 5 per group. ***Significantly different from control, p < 0.001 (ANOVA). H-K, Transverse sections of upper lumbar ventral horn 14 d after injection of vehicle (H) or NMDA (I-K). Cresyl violet staining (H, I) reveals pronounced loss of ventral horn neurons induced by NMDA (I). Immunohistochemical staining for CD45 in an adjacent tissue section reveals modest inflammatory response in ventral horn after NMDA (J). K, L, Laser-scanning confocal microscopy of triple staining for astrocytes (GFAP), inflammatory cells (CD45), and neurons (NeuN) to compare the inflammatory response after injection of NMDA (K) or ablation of astrocytes in GFAP-TK transgenic mice treated with GCV (L). Both experimental conditions cause severe loss of NeuN-positive neurons (K, L). CD45-positive inflammatory cells exhibit a mild inflammatory response after NMDA, which induces pronounced GFAP-positive astrogliosis (K). In contrast, CD45-positive inflammatory cells exhibit a pronounced inflammatory response in the absence of reactive astrocytes (L). Scale bars: A, C, 100 μm; B, D, 50 μm; E, F, 5 μm; H-J, 50 μm; K, L, 15 μm.
Figure 6.
Figure 6.
Degeneration of neurons after ablation of reactive astrocytes adjacent to stab SCI. A-D, F, Transverse sections of upper lumbar spinal cord after longitudinal stab SCI (arrowheads) in a nontransgenic mouse given GCV (A, B, F; NT+GCV) or in a GFAP-TK transgenic mouse given GCV (C, D; Tg+GCV). A-D, Staining with cresyl violet (c.v.) reveals no detectable loss of neurons adjacent to stab SCI in the nontransgenic mouse (A, B), in contrast to pronounced neuronal loss in the GFAP-TK transgenic mouse given GCV (C, D). B, D, Details, respectively, of boxed areas in A and C, showing that neurons of all sizes appear healthy in the neural parenchyma adjacent to the SCI in the control mouse, and there is little or no evidence of neuronal degeneration (B); in contrast, there is pronounced neuronal degeneration in the region from which astrocytes have been ablated in the GFAP-TK transgenic mouse given GCV (D). E, Mean cell number ± SEM of cresyl violet-stained neurons within the wound margin adjacent to the stab injury (see Fig. 1D); GFAP-TK mice given GCV exhibited fourfold fewer neurons compared with control mice; n = 5 per group. ***Significantly different from control, p < 0.001 (ANOVA). F, Laser-scanning confocal microscopy of double staining for astrocytes (GFAP) and neurons (NeuN) showing that reactive astrocytes and their processes intermingle extensively among NeuN-positive neurons in the ventral horn after SCI in a control mouse. H-I, Transverse sections of upper lumbar ventral horn 14 d after injection of LPS. Cresyl violet staining reveals no detectable loss of ventral horn neurons induced by LPS (G). Immunohistochemical staining for CD45 in an adjacent tissue section reveals a pronounced inflammatory response and infiltration of leukocytes into the ventral horn induced by LPS (H). I, Laser-scanning confocal microscopy of triple staining for astrocytes (GFAP), neurons (NeuN), and inflammatory cells (CD45) showing that, in the presence of astrocytes, NeuN-positive neurons survive well despite the presence of many CD45-positive inflammatory cells in the ventral horn after LPS injection. Scale bars: A, C, G,H, 100 μm; B, D ,50 μm; F, I, 15 μm.
Figure 7.
Figure 7.
Loss of white matter and degeneration of oligodendrocytes after ablation of reactive astrocytes adjacent to stab SCI. A, B, Transverse sections of upper lumbar spinal cord after longitudinal stab SCI (arrowheads) in control GFAP-TK transgenic mouse not given GCV (A; Tg no GCV) and in a GFAP-TK transgenic mouse given GCV (B; Tg+GCV). Staining with Luxol fast blue (LFB) reveals minimal loss of myelin adjacent to stab SCI in the control mouse (A), in contrast to severe myelin loss in the GFAP-TK transgenic mouse given GCV (B). Boxed areas in survey images are shown as details of dorsal columns (dc) next to gray matter (g) and lateral columns (lc), both contralateral and ipsilateral to the stab SCI. Dotted lines demarcate tissue areas of partially degenerated myelin (dm). Note that dorsal roots (dr) and ventral roots (vr) retain myelin immediately adjacent to severely demyelinated CNS white matter in the GFAP-TK mouse (B), indicating that LFB staining has worked successfully. C-E, Transverse sections of upper lumbar spinal cord showing uninjured tissue (C) or tissue adjacent to longitudinal stab SCI in a nontransgenic mouse (D; NT+GCV) or in a GFAP-TK transgenic mouse given GCV (E; Tg+GCV). Immunohistochemistry for MBP shows no detectable difference in the number of MBP-stained oligodendrocytes (arrows) in uninjured tissue (C) and tissue adjacent to stab SCI in the nontransgenic mouse (D), in contrast to pronounced loss of oligodendrocytes in the GFAP-TK transgenic mouse given GCV (E). F, Mean area ± SEM of Luxol fast blue-stained myelin in dorsal and lateral columns adjacent to stab SCI. The area of white matter exhibiting LFB-stained intact myelin ipsilateral and adjacent to the SCI is expressed as a percentage of the area in the equivalent region on the uninjured contralateral side. GFAP-TK mice given GCV exhibited a significantly greater decline in area of myelinated white matter next to the SCI compared with injured control mice; n = 6 per group. **Significantly different from control, p < 0.001 (ANOVA). G, Mean number ± SEM of MBP-stained oligodendrocyte cell bodies in white matter ipsilateral and adjacent to stab SCI or in uninjured tissue. GFAP-TK mice given GCV exhibited a significantly greater decline in the number of oligodendrocytes next to the SCI compared with injured control mice; n = 5 per group. ***Significantly different from control, p < 0.0005 (ANOVA). Scale bars: A, B, surveys, 100 μm; A, B, details, 50 μm; C-E, = 25 μm.
Figure 8.
Figure 8.
Loss of hindlimb function after ablation of reactive astrocytes adjacent to stab SCI. A, Time course of left hindlimb (HL) locomotor performance in an open field over 14 d after ipsilateral stab SCI in control mice and GFAP-TK transgenic mice given GCV (Tg+GCV). Three groups of control mice were evaluated: nontransgenic mice not given GCV, nontransgenic mice given GCV, and transgenic mice not given GCV. No significant difference was detected among these control groups (ANOVA), and their values were pooled to a single control value. Control mice (n = 14) exhibited no visibly detectable impairment of ipsilateral hindlimb performance after stab SCI, whereas transgenic mice given GCV (n = 7) exhibited a gradual but ultimately substantial and significant impairment during and after ablation of reactive astrocytes. ***Significantly different from control, p < 0.001 (ANOVA plus post hoc pair-wise analysis). B, Time course of rotorod performance after SCI of control mice and GFAP-TK transgenic mice given GCV. Control mice (n = 9; pooled values of three groups not significantly different by ANOVA) exhibited an initial mild impairment of rotorod performance after stab SCI that was fully reversible by 14 d. In contrast, transgenic mice given GCV (n = 5) failed to recover rotorod performance during and after ablation of reactive astrocytes and by 14 d exhibited a substantial and significant impairment. ***Significantly different from control, p < 0.001 (ANOVA plus post hoc pair-wise analysis). C, Representative footprint analysis at 14 d after stab SCI of a control mouse and a GFAP-TK transgenic mouse given GCV. Footprints of a control mouse illustrate normal plantar placement of forepaws and hindpaws. In contrast, footprints of a transgenic mouse given GCV show no plantar placement of the left (L, ipsilateral) hindpaw (circles show placement of only the left forepaw), which is indicative of foot dragging on the dorsal surface. In addition, the right (R, contralateral) hindpaw shows smears (arrow) indicative of toe dragging.
Figure 9.
Figure 9.
Persisting loss of motor function after ablation of reactive astrocytes in crush SCI. A, Time course of left hindlimb locomotor performance in an open field over 14 d after moderately severe forceps crush SCI in control mice and GFAP-TK transgenic mice given GCV (Tg+GCV). Control mice (n = 8) exhibited an initial impairment of bilateral (both sides scored individually and averaged) hindlimb performance after crush SCI that was fully reversible by 14 d. In contrast, transgenic mice (n = 7) given GCV failed to recover bilateral hindlimb performance during and after ablation of reactive astrocytes and by 14 d exhibited a substantial and significant impairment. *Significantly different from control, p < 0.05 (ANOVA plus post hoc pair-wise analysis). B, Time course of rotorod performance after SCI in control mice and GFAP-TK transgenic mice given GCV. Control mice (n = 8) exhibited an initial mild impairment of rotorod performance after crush SCI that was fully reversible by 14 d. In contrast, transgenic mice (n = 7) given GCV failed to recover rotorod performance during and after ablation of reactive astrocytes and by 14 d exhibited a substantial and significant impairment. *Significantly different from control, p < 0.05 (ANOVA plus post hoc pair-wise analysis). C, Representative footprint analysis at 14 d after crush SCI of a control mouse and a GFAP-TK transgenic mouse given GCV. Footprints of a control mouse illustrate normal plantar placement of forepaws and hindpaws. In contrast, footprints of a transgenic mouse given GCV exhibit smears on the left side (L, left arrow) indicative of toe dragging as well as frequent failure of plantar placement of the left hindpaw (circles show placement of only the left forepaw) indicative of dorsal foot dragging, and on the right (R) side, the hindpaw shows substantial smears (right arrow) indicative of toe dragging and uncoordinated hindpaw placements.
Figure 10.
Figure 10.
Increased lesion volume after ablation of reactive astrocytes in crush SCI. A, B, Horizontal sections of the lower thoracic and upper lumber spinal cord (rostral is to the right) 14 d after forceps crush SCI (arrowheads) of similar severity in a nontransgenic mouse given GCV (A; NT+GCV) or in a GFAP-TK transgenic mouse given GCV (B; Tg+GCV). Staining with cresyl violet (c.v.) reveals a compact centrally placed lesion with clearly delineated boundaries in the nontransgenic mouse, and there are many normally appearing neurons immediately next to the lesion (A). In contrast, the lesion is large, diffuse, and without clear boundaries in the GFAP-TK transgenic mouse given GCV, and there is clear evidence of neuronal loss at considerable distances away from the crush center (B). C, D, Dorsal view of three-dimensional reconstructions of the outer walls (white) of the lower thoracic and upper lumber spinal cord (rostral is to the right) generated from horizontal cresyl violet-stained tissue sections using NeuroLucida. Visible inside the cord are the reconstructed lesions (red) after forceps crush stab SCI of similar severity in a nontransgenic mouse given GCV (C) or in a GFAP-TK transgenic mouse given GCV (D). E, Mean lesion volume ± SEM determined from the three-dimensional reconstructions. GFAP-TK mice given GCV exhibit a fivefold greater lesion volume compared with control mice; n = 5 per group. ***Significantly different from control, p < 0.001 (ANOVA). Scale bars, 400 μm.
Figure 11.
Figure 11.
Increased inflammation, demyelination, and failure of wound contraction after ablation of reactive astrocytes in crush SCI. A-J, Horizontal sections of the lower thoracic and upper lumber spinal cord 14 d after forceps crush SCI (arrowheads) of similar severity in nontransgenic mice given GCV (A, C, E, G, I; NT+GCV) or in GFAP-TK transgenic mice given GCV (B, D, F, H, J; Tg+GCV). Nontransgenic mice exhibit compact central lesions lined by a clearly demarcated scar comprising GFAP-positive, reactive astrocytes as well as fibronectin-positive fibroblasts (C, G), and the lateral columns immediately adjacent to the central lesion remain well myelinated, as demonstrated by Luxol fast blue (LFB) staining (I, arrow). Many of the scar-forming astrocytes that line the lesion divided after SCI and exhibit staining for both BrdU and GFAP, as demonstrated by scanning confocal laser microscopy (A, C, insets). The lesions are filled with CD45-positive inflammatory cells (E). In contrast, GFAP-TK transgenic mice given GCV exhibit large diffuse lesions that have no obvious boundaries and are not delineated by a detectable scar (B, D, F, H), and the lateral columns adjacent to the lesion are severely demyelinated, as demonstrated by Luxol fast blue staining (J, arrow). Lesions in these mice contain almost no reactive astrocytes that are positive for BrdU or GFAP (B, D) and exhibit widespread and dispersed infiltration of CD45-positive inflammatory cells, many of which have the appearance of large, ovoid, and active macrophages (F). These lesions also exhibit a widespread and diffuse distribution of fibronectin-positive fibroblasts that do not cluster along a detectable border of the lesion (H). Scale bars: A-H, 200 μm; I, J, 100 μm.
Figure 12.
Figure 12.
Central lesion exhibiting loss of neurons and nerve fibers, pronounced inflammation, and absence of reactive astrocytes after crush SCI in nontransgenic mice. A-F, Closely neighboring immunohistochemically stained horizontal sections of the lower thoracic and upper lumber spinal cord 14 d after moderately severe forceps crush SCI (arrowheads) in a nontransgenic mouse not given GCV (NT-GCV). The compact central lesion at the crush site contains no viable neurons and only a few scattered nerve fibers, as detected by staining for NFM (A, B), is clearly demarcated by a scar of reactive astrocytes (C, D), and is filled with CD45-positive inflammatory cells (E, F). B, D, F, Details, respectively, of boxed areas in A, C, and E and show the sharply defined border between the lesion and viable tissue, which is defined by densely packed processes of GFAP-expressing reactive astrocytes (C, D). There is a strict and essentially absolute correlation between the presence of neural elements, both nerve fibers and neuronal cell bodies (arrow), and the presence of reactive astrocytes in viable tissue right up to the border of the lesion, whereas the central lesion contains essentially no neural elements or astrocytes (A-D). Conversely, activated inflammatory cells are numerous and densely packed within the central lesion in the absence of astrocytes, whereas they are few and scattered in tissue-containing reactive astrocytes (C-F). Scale bars: A, C, E, 100 μm; B, D, F, 50 μm.

References

    1. Agrawal SK, Fehlings MG (1997) Role of NMDA and non-NMDA ionotropic glutamate receptors in traumatic spinal cord axonal injury. J Neurosci 17: 1055-1063. - PMC - PubMed
    1. Andersson P-B, Perry VH, Gordon S (1992) The acute inflammatory response to lipopolysaccharide in CNS parenchyma differs from that in other body tissues. Neuroscience 48: 169-186. - PubMed
    1. Basso DM, Beattie MS, Bresnahan JC (1995) A sensitive and reliable locomotor rating scale for open field testing in rats. J Neurotrauma 12: 1-21. - PubMed
    1. Behrmann DL, Bresnahan JC, Beattie MS (1994) Modeling of acute spinal cord injury in the rat: neuroprotection and enhanced recovery with methylprednisolone, U-74006F and YM-14673. Exp Neurol 126: 61-75. - PubMed
    1. Borrelli E, Heyman RA, Arias C, Sawchenko PE, Evans RM (1989) Transgenic mice with inducible dwarfism. Nature 339: 538-541. - PubMed

Publication types

MeSH terms