. 2004 Mar 3;24(9):2247-58.
doi: 10.1523/JNEUROSCI.5285-03.2004.

Loss of glutamatergic pyramidal neurons in frontal and temporal cortex resulting from attenuation of FGFR1 signaling is associated with spontaneous hyperactivity in mice

Affiliations

Loss of glutamatergic pyramidal neurons in frontal and temporal cortex resulting from attenuation of FGFR1 signaling is associated with spontaneous hyperactivity in mice

Dana M Shin et al. J Neurosci. .

Abstract

Fibroblast growth factor receptor (FGFR) gene products (Fgfr1, Fgfr2, Fgfr3) are widely expressed by embryonic neural progenitor cells throughout the CNS, yet their functional role in cerebral cortical development is still unclear. To understand whether the FGF pathways play a role in cortical development, we attenuated FGFR signaling by expressing a tyrosine kinase domain-deficient Fgfr1 (tFgfr1) gene construct during embryonic brain development. Mice carrying the tFgfr1 transgene under the control of the Otx1 gene promoter have decreased thickness of the cerebral cortex in frontal and temporal areas because of decreased number of pyramidal neurons and disorganization of pyramidal cell dendritic architecture. These alterations may be, in part, attributable to decreased genesis of T-Brain-1-positive early glutamatergic neurons and, in part, to a failure to maintain radial glia fibers in medial prefrontal and temporal areas of the cortical plate. No changes were detected in cortical GABAergic interneurons, including Cajal-Retzius cells or in the basal ganglia. Behaviorally, tFgfr1 transgenic mice displayed spontaneous and persistent locomotor hyperactivity that apparently was not attributable to alterations in subcortical monoaminergic systems, because transgenic animals responded to both amphetamine and guanfacine, an alpha2A adrenergic receptor agonist. We conclude that FGF tyrosine kinase signaling may be required for the genesis and growth of pyramidal neurons in frontal and temporal cortical areas, and that alterations in cortical development attributable to disrupted FGF signaling are critical for the inhibitory regulation of motor behavior.


Figures

Figure 1.
Figure 1.
Structure and expression of the Otx1-tFgfr1 transgene. A, Structure of the mouse two-Ig variant Fgfr1 gene product and the kinase domain-truncated tFgfr1 construct. S, Signal sequence; a, acidic box; ig, immunoglobulin-like domain; TM, transmembrane domain. B, The tFgfr1 construct was placed downstream from the Otx1 5′ region and β-globin intron and upstream from the human growth hormone polyadenylation region P(A). Transgene-specific sequences used as probes for in situ hybridization are indicated by a black bar, and sequences used to design PCR primers are indicated by arrowheads. C, In situ hybridization with the transgene-specific probe indicated in B, showing that line 33 mice express the Otx1-tFgfr1 gene in the telencephalon, diencephalon, and mesencephalon when examined at E14.5. D, Time course RT-PCR for the transgene mRNA expression level in brain at different developmental time points (10.5, E10.5; 14.5, E14.5; B, birth; A, adult at 6 months of age).
Figure 2.
Figure 2.
Cytoarchitecture of the cerebral cortex at P0. A-D, I, K, Wild type; E-H, J, L, tFgfr1. I-L, Enlarged view of the boxed areas in B and F, and D and H, respectively. Cresyl violet staining of rostral coronal sections showing that in medial prefrontal cortical areas (between arrowheads), the CP thickness is decreased, and cellular layers are disorganized in transgenic animals (E,F,J) as compared with wild-type counterparts (A,B,I). Cresyl violet staining of caudal coronal sections show a decrease in thickness of temporal cortical areas (indicated by arrowheads) in transgenic animals (G,H,L) as compared with wild-type littermates (C,D,K). hi, Hippocampus; ha, habenula; mg, medial geniculate nucleus; sc, superior colliculus; st, striatum; vmt, ventromedial thalamic nucleus. Scale bars: A-H, 400 μm; I-L, 50 μm.
Figure 3.
Figure 3.
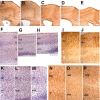
Cytoarchitecture and cellular phenotypes in the adult prefrontal cortex. A, B, F, I, K, N, Wildtype; C, D, G, H, J, L, M, O, tFgfr1 line 33; E, P, tFgfr1 line 19. A-E, Fewer SMI-32 immunoreactive pyramidal projection neurons with less prominent apical dendrites are present in two tFgfr1 mice from line 33 (C,D) and line 19 (E) as compared with two littermate controls (A,B). Black bars in A-D delineate subcortical white matter. F-H, Cresyl violet staining shows greatly decreased thickness of infragranular cortical layers in the dorsal prefrontal cortex of the two Otx1-tFgfr1 mutants of line 33 (G,H) as compared with the wild-type control (F). I, J, Calbindin-immunoreactive interneurons in top layers are not substantially affected in tFgfr1 transgenic mice. K-P, High magnification of the cresyl violet staining and SMI-32 immunostaining in dorsal prefrontal cortex demonstrating the collapsed cortical laminas and apparent absence of large pyramidal neurons of layer 5 in line 33 tFgfr1 mutant mice (L,M) as compared with the wild-type control (K). Also note the decreased density of SMI-32-positive pyramidal neurons and decreased immunostaining of apical dendrites in line 33 and line 19 mutants (O,P) as compared with the wild-type mouse (N). Right is medial and top is dorsal in all figures; cortical layers are in roman numerals. Scale bars: A-E, 400 μm; F-H, 200 μm; I-P, 100 μm.
Figure 4.
Figure 4.
Cytoarchitecture and cellular phenotypes of the temporal cortex at adulthood. A-H, Wild type; I-P, tFgfr1. Cresyl violet staining of adult coronal sections showing the temporal cortical region of wild type (A) and tFgfr1 (I). B and J are enlarged views of the boxed areas in A and I, respectively. Note the absent layer organization of the temporal cortical area in J. SMI-32 immunoperoxidase staining of wild type (C,F) in the temporal cortical area. F is a high magnification of C. Note the absence of SMI-32 immunoreactive cell bodies or the apical dendrites in the corresponding cortical area in transgenic animals (K,N). N is the enlarged view of K. In contrast, the density of GABAergic cells seems unaffected in transgenic animals (L,O) compared with the wild-type counterparts (D,G). G and O are the enlarged views of D and L, respectively. There is decreased density of calbindin-28KD-immunoreactive cells in deeper layers of the temporal cortical area in transgenic animals (M,P) as compared with wild-type mice (E,H). H and P are enlarged views of E and M, respectively. Scale bars: A, C-E, I, K-M, 400 μm; B, F-H, J, N-P, 100 μm.
Figure 5.
Figure 5.
Radial glia morphology in the developing cerebral cortex at E18.5. A-C, Wild-type mice; D-F, tFgfr1 mutants. A, D, RC-2 immunoperoxidase staining of the medial prefrontal areas taken from midsagittal brain sections of E18.5 embryos. Note the elongated radial glial fibers reaching the pial layer in wild type (A, arrowheads) and the fewer, fragmented, abnormal glia fibers in tFgfr1 (D, arrowheads). Anterior is to the left. B-F, GLAST immunofluorescence staining of the temporal cortical areas taken from coronal brain sections at the level of lateral geniculate nuclei (B,E) or at more posterior levels (C,F). Note similar absence of elongated radial glial processes in tFgfr1 (E,F) as compared with wild type (B,C). Arrowheads point to radial glial processes in the CP. Medial is to the right and dorsal is to the top. Scale bars: A, C, 100 μm; B, D, 200 μm; C, F, 50 μm.
Figure 6.
Figure 6.
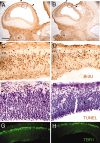
Decrease in cell proliferation but no changes in apoptosis in the presumptive temporal neuroepithelium and reduction in the number of TBR1 immunoreactive cells at E12.5. A, C, E, G, Wild type; B, D, F, H, tFgfr1. A-D, BrdU staining of lateral sagittal sections of E12.5 embryos that were harvested 30 min after a BrdU injection. In tFgfr1 (B,D), the number of BrdU-labeled cells as well as the thickness of the cortical neuroepithelium and the PPL are severely reduced in the middle portion of the prospective temporal cortex (indicated by arrows). C and D are enlarged views of the boxed areas in A and B, respectively. E, F, No differences in apoptotic cells between wild type and tFgfr1 were noted by TUNEL staining. E and F are the adjacent sections of A and B, respectively; arrowheads indicate TUNEL-positive cells (brown). Sections were counterstained by cresyl violet. G, H, The number of TBR1-immunoreactive cells is slightly reduced in the middle portion of the prospective temporal cortex where the defects were noticed with the BrdU labeling experiment. Scale bars: A, B, 400 μm; C-F, 50 μm; G, H, 100 μm.
Figure 7.
Figure 7.
Decrease in Tbr1 expression in neuronal nuclei within the prospective medial prefrontal and temporal cortical areas at E18.5. A-E, Wild type; F-L, tFgfr1. A-C, F-H, Frontal regions; D, E, I-L, temporal regions. Note the absence of discrete nuclear staining in the mutant medial prefrontal (H) and temporal cortical regions (L) as compared with the corresponding medial prefrontal (C) and temporal (E) regions of wild-type mice. In contrast, nuclear TBR1 staining is fairly normal in more lateral frontal regions of mutant mice (B,G). Dorsal is to the top and medial is to the right in all figures. dg, Dentate gyrus. Scale bars: A, D, F, I, 200 μm; B, C, E, G, H, L, 50 μm.
Figure 8.
Figure 8.
Locomotor activity is increased in transgenic tFgfr1 mice as compared with littermate control animals. Activity counts are expressed as the mean (±SEM) number of photocell beam brakes and are shown for 60 min at 5 min intervals after injection. There were 8-18 mice per group depending on condition. A, Transgenic tFgfr1 mice displayed marked increases in locomotor activity compared with control animals under baseline conditions (saline). Amphetamine, at a moderate dose (2.0 mg/kg), increased locomotor activity in both transgenic and control animals relative to saline injections. Activity rates were markedly increased but transiently in tFgfr1 mice. B, Conversely, the selective α2A adrenergic receptor agonist guanfacine (1.0 mg/kg) reduced locomotor activity rates in both transgenic and control animals. Although activity rates in tFgfr1 mice were normalized by guanfacine, this effect was transient and eventually was not different from transgenic animals given saline.

References

    1. Amaya E, Musci TJ, Kirschner MW (1991) Expression of a dominant negative mutant of the FGF receptor disrupts mesoderm formation in Xenopus embryos. Cell 66: 257-270. - PubMed
    1. Anderson SA, Eisenstat DD, Shi L, Rubenstein JL (1997) Interneuron migration from basal forebrain to neocortex: dependence on Dlx genes. Science 278: 474-476. - PubMed
    1. Anton ES, Marchionni MA, Lee KF, Rakic P (1997) Role of GGF/neuregulin signaling in interactions between migrating neurons and radial glia in the developing cerebral cortex. Development 124: 3501-3510. - PubMed
    1. Assimacopoulos S, Grove EA, Ragsdale CW (2003) Identification of a Pax6-dependent epidermal growth factor family signaling source at the lateral edge of the embryonic cerebral cortex. J Neurosci 23: 6399-6403. - PMC - PubMed
    1. Ballard TM, Pauly-Evers M, Higgins GA, Ouagazzal AM, Mutel V, Borroni E, Kemp JA, Bluethmann H, Kew JN (2002) Severe impairment of NMDA receptor function in mice carrying targeted point mutations in the glycine binding site results in drug-resistant nonhabituating hyperactivity. J Neurosci 22: 6713-6723. - PMC - PubMed

Publication types

MeSH terms