

Comparative Study
doi: 10.1186/gb-2004-5-3-r19.
Epub 2004 Feb 26.
FlyGEM, a full transcriptome array platform for the Drosophila community
Affiliations
- PMID: 15003122
- PMCID: PMC395769
- DOI: 10.1186/gb-2004-5-3-r19
Item in Clipboard
Comparative Study
FlyGEM, a full transcriptome array platform for the Drosophila community
Genome Biol.
2004.
Abstract
We have constructed a DNA microarray to monitor expression of predicted genes in Drosophila. By using homotypic hybridizations, we show that the array performs reproducibly, that dye effects are minimal, and that array results agree with systematic northern blotting. The array gene list has been extensively annotated and linked-out to other databases. Incyte and the NIH have made the platform available to the community via academic microarray facilities selected by an NIH committee.
Figures
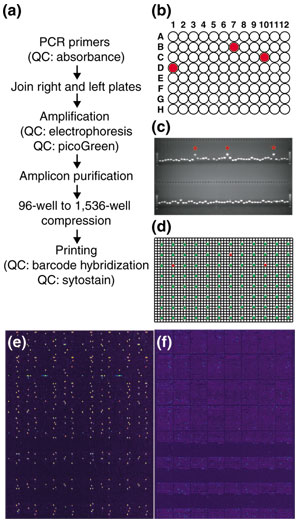
Process flow and in-process quality control for manufacturing the Drosophila FlyGEM. (a) The process flow for generation of PCR product for arraying and in-process quality-control measures (QC) are represented. (b) Barcode primers are located at unique positions in each plate (red wells in plate cartoon). (c) A typical agarose gel following electrophoresis of amplicons. The barcode amplicons migrate more slowly and allow for tracking after PCR (red asterisk). (d) 96-well plates of purified PCR product were collapsed into ten 1,536-well plates for printing. An individual plate barcode position (red) and all other barcodes (green) are shown. Post-hybridization QCs included (e) oligo hybridization to the barcoding elements and (f) syto-staining. Note the unprinted area available for adding new elements to the platform.
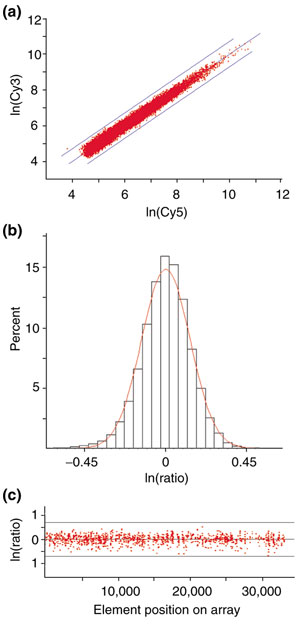
Homotypic hybridizations. (a) A typical hybridization where a single RNA pool was split and labeled with Cy3 and Cy5. For each element, intensities in each channel are plotted against each other. The central diagonal line represents equivalent intensities and the flanking lines twofold differences in intensity. (b) Data points from four such homotypic hybridizations were used to construct the histogram, which shows the distribution or 'bandwidth' of gene elements (as a percentage of the total) around the natural logarithm of the expected ratio of 1.0. As relative fluorescence can vary with laser power, spectral line and bandwidth and other detector parameters, it is more useful to express results as ratios, a unit-less term. (c) The ratio plotted against position of the element on the array. The parallel lines are at equivalent intensities and at twofold differences in intensity.
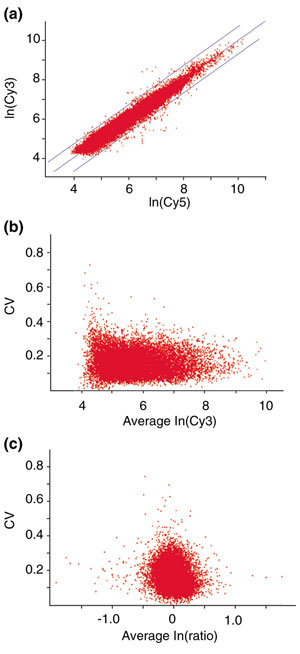
Heterotypic hybridizations. (a) A plot of a Cy3-labeled RNA from Antp76B/TM3 adults competitively hybridized to the array with Cy5-labeled RNA prepared from wild-type adults. (b) The coefficients of variance (CV) for all gene elements in (a) are plotted out as a function of Cy3 signal intensity. (c) The CV plotted as a function of differential expression.
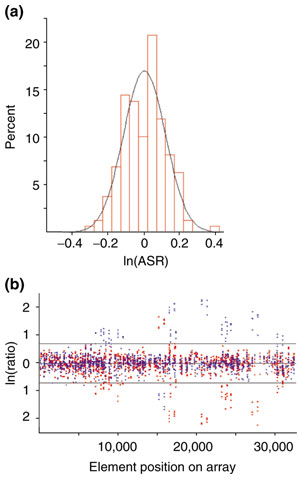
Dye-flip hybridizations. (a) A histogram showing the distribution of all elements (as a percent of the total) as a function of axial symmetry of reflection (ASR, a ratio vs ratio plot, see text). This is a measure of the contribution of dye effects to the results of a heterotypic hybridization. (b) The ratio plotted against position of the element on the array. The dye-reversed hybridizations are coded blue or red. Note the symmetrical patterns of differential expression as well as the bulk non-differential expression at a ratio of 1 (0 in log space). Experiments were performed in quadruplicate.
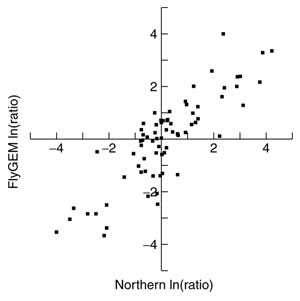
Comparison of FlyGEM and northern expression analysis. Differential expression values for whole adult females versus males determined from northern analysis or microarray analysis are plotted.
References
-
- Misra S, Crosby MA, Mungall CJ, Matthews BB, Campbell KS, Hradecky P, Huang Y, Kaminker JS, Millburn GH, Prochnik SE, et al. Annotation of the Drosophila melanogaster euchromatic genome: a systematic review. Genome Biol. 2002;3:research0083.1–0083.22. doi: 10.1186/gb-2002-3-12-research0083. - DOI - PMC - PubMed
-
- Rozen S, Skaletsky H. Primer3 on the WWW for general users and for biologist programmers. Methods Mol Biol. 2000;132:365–386. - PubMed
Publication types
MeSH terms
Substances
Grants and funding
LinkOut - more resources
Full Text Sources
Other Literature Sources
Molecular Biology Databases
