. 2004 Mar;34(3):499-509.
doi: 10.1016/j.bone.2003.11.022.

Delineating bone's interstitial fluid pathway in vivo

Affiliations

Delineating bone's interstitial fluid pathway in vivo

Liyun Wang et al. Bone. 2004 Mar.

Abstract

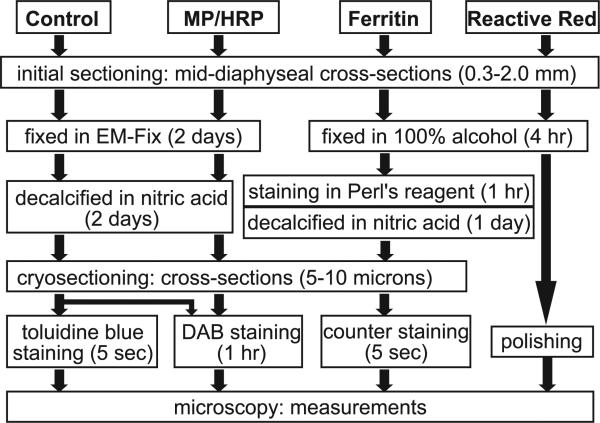
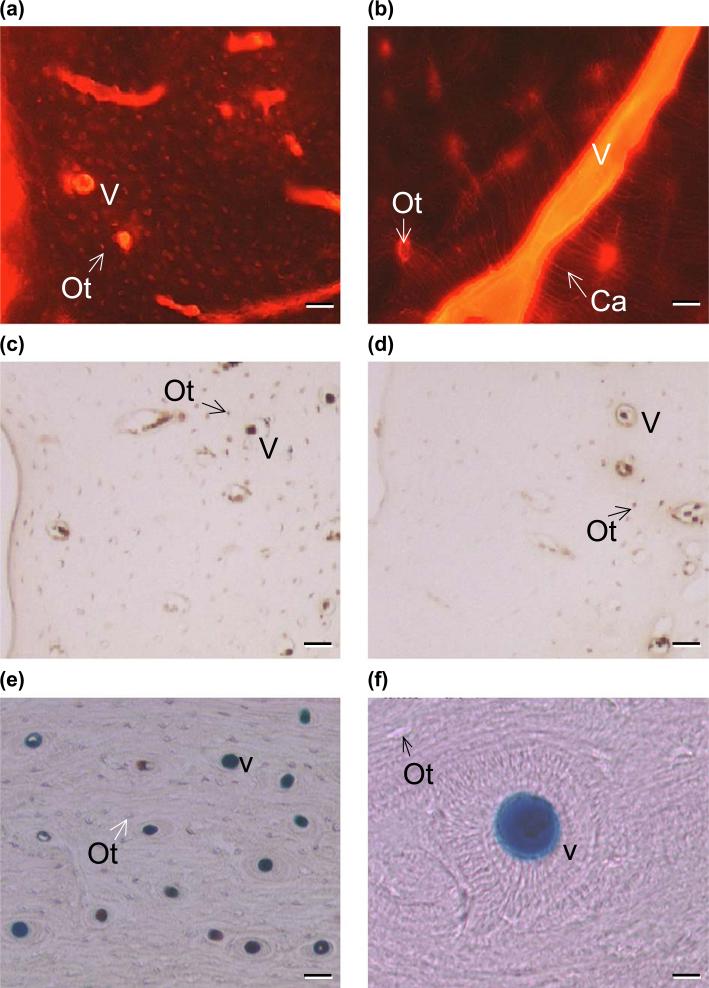
Although interstitial fluid flow has been suggested to play a role in bone adaptation and metabolism, the constituents and ultrastructure of this interstitial fluid pathway are not well understood. Bone's lacunar-canalicular porosity is generally believed to be a continuous interstitial fluid pathway through which osteocytes sense external mechanical loading as well as obtain nutrients and dispose of wastes. Recent electron microscopy studies have suggested that a fiber matrix surrounds the osteocytic cell processes and fills this pericellular fluid space. However, studies injecting tracer molecules into the bone vasculature have provided conflicting results about the pore size or the fiber spacing of the interstitial fluid pathway. In addition, whether the smaller collagen-apatite porosity in adult bone is also a continuous fluid pathway is still unclear. To delineate bone's interstitial fluid pathway, four tracers of various size were injected into rats: reactive red (approximately 1 nm), microperoxidase (MP, approximately 2 nm), horseradish peroxidase (HRP, approximately 6 nm), and ferritin (approximately 10 nm). Five minutes after injection, the tibiae were harvested and processed using histological protocols optimized to minimize processing time to reduce possible redistribution of tracer molecules. The number of blood vessels and osteocytic lacunae labeled with the tracers per unit bone area was then measured for mid-diaphysial cross-sections of the tibia. While none of the tracers was detected within the mineralized bone matrix (the collagen-apatite porosity) using light microscopy, all the tracers except ferritin were found to pass through the canaliculi and appear in the osteocytic lacunae. These results indicate that while small tracers (<6 nm) readily pass through the lacunar-canalicular porosity in the absence of mechanical loading, there appears to be an upper limit or cutoff size between 6 and 10 nm for molecular movement from bone capillaries to osteocytic lacunae in rat long bone. This range of pore size contains the most likely fiber spacing (approximately 7 nm) that has been proposed for the lacunar-canalicular annular space based on the presence of a proteoglycan fiber matrix surrounding the osteocyte.


Figures

Fig. 1
Fig. 1
Histological processing protocols for the rat tibiae injected with control (saline), and microperoxidase (MP), horseradish peroxidase (HRP), ferritin, and reactive red tracers. Visualization of the four tracers was achieved by the colored end products of either DAB staining (for MP and HRP) or Prussian Blue (for ferritin), or by fluorescence (for reactive red). The control group served as a negative control of DAB staining for the MP and HRP groups and as a baseline measurement control (stained with toluidine blue) for all the tracer groups. EM-Fix: 0.5% glutaraldehyde and 2% paraformaldehyde in 0.05 M sodium cacodylate buffer. Perl's reagent: a freshly made 1:1 mixture of 4% potassium ferrocyanide and 4% hydrochloric acid. DAB: 3,3′-diaminobenzidine tetrahydrochloride.
Fig. 2
Fig. 2
A cross-section of the mid-diaphysis of the rat right tibia. Measurements of bone area (B.Ar) and the numbers of labeled osteocytic lacunae (N.Ot) and blood vessels (N.Bv) were performed on three sampling regions: anterior (A), posterior lateral (L), and posterior medial (M) regions in the cortex between the endosteal surface (Es) and the periosteal surface (Ps). The mean values of the measurements from these three regions in three cross-sections were reported for each animal and used in the subsequent statistical analyses (magnification: 35×; scale bar: 0.5 mm).
Fig. 3
Fig. 3
Tracer labeling at the posterior medial region of the rat tibia. (a) Reactive red appeared in most blood vessels (v) and osteocytic lacunae (Ot) (magnification: 350×, scale bar: 40 μm). (b) Reactive red appeared in canaliculi (Ca) but did not appear to be present in the mineralized matrix (magnification: 1400×, scale bar: 10 μm). (c) MP labeled blood vessels and osteocytic lacunae (shown in brown) (magnification: 350×, scale bar: 40 μm). (d) HRP showed similar labeling as MP (magnification: 350×, scale bar: 40 μm). (e) Ferritin was found in blood vessels (shown in blue) without labeling the surrounding osteocytic lacunae (magnification: 350×, scale bar: 40 μm). (f) Ferritin labeling was confined to vascular pores and did not appear to penetrate the collagen–apatite pores within the mineralized matrix (magnification: 1400×, scale bar: 10 μm).
Fig. 4
Fig. 4
(a) The density of labeled blood vessels (Den.Bv, #mm2) showed no significant differences among control (Ctrl), MP, HRP, and ferritin (Fe) groups. (b) The density of the osteocytic lacunae (Den.Ot, #mm2) labeled with reactive red (R-Red), MP, and HRP decreased as the tracer size increased from approximately 1 to 6 nm. All the osteocytic lacunae were stained with toluidine blue in the control group (Ctrl), while none of the osteocytic lacunae was labeled with ferritin (approximately 10 nm diameter). Due to the zero variance of the measurements, the ferritin group was not included in the statistical analysis and is not shown in this plot. Despite the decreasing trend, no significant differences of group means were found among the groups examined here, although the difference between HRP and control was approaching significance ( P = 0.054).
Fig. 5
Fig. 5
Unlike those confined to the vascular pores shown in Figs. 3e and 3f, ferritin “halos” (indicated with arrows) were found to appear inside the bone matrix after processing rat samples in Perl's reagent for 3 h, followed by decalcification in sodium citrate/formic acid for 5 days and paraffin embedding with hematoxylin counterstain.

References

    1. Aarden EM, Wassenaar AM, Alblas MJ, Nijweide PJ. Immunocyto-chemical demonstration of extracellular matrix proteins in isolated osteocytes. Histochem Cell Biol. 1996;106:495–501. - PubMed
    1. Ayasaka N, Kondo T, Goto T, Kido MA, Nagata E, Tanaka T. Differences in the transport systems between cementocytes and osteocytes in rats using microperoxidase as a tracer. Arch Oral Biol. 1992;37:363–9. - PubMed
    1. Burger EH, Klein-Nulend J. Mechanotransduction in bone—Role of the lacuno-canalicular network. FASEB J. 1999;13:S101–12. - PubMed
    1. Cooper RR, Milgram JW, Robinson RA. Morphology of the osteon. An electron microscopic study. J Bone Joint Surg Am. 1966;48:1239–71. - PubMed
    1. Cowin SC, Weinbaum S, Zeng Y. A case for bone canaliculi as the anatomical site of strain generated potentials. J Biomech. 1995;28:1281–97. - PubMed

Publication types

Substances

LinkOut - more resources