. 2004 May;15(5):2492-508.
doi: 10.1091/mbc.e03-09-0634. Epub 2004 Mar 5.

The chemokine receptor D6 constitutively traffics to and from the cell surface to internalize and degrade chemokines

Affiliations

The chemokine receptor D6 constitutively traffics to and from the cell surface to internalize and degrade chemokines

Michele Weber et al. Mol Biol Cell. 2004 May.

Abstract

The D6 heptahelical membrane protein, expressed by lymphatic endothelial cells, is able to bind with high affinity to multiple proinflammatory CC chemokines. However, this binding does not allow D6 to couple to the signaling pathways activated by typical chemokine receptors such as CC-chemokine receptor-5 (CCR5). Here, we show that D6, like CCR5, can rapidly internalize chemokines. However, D6-internalized chemokines are more effectively retained intracellularly because they more readily dissociate from the receptor during vesicle acidification. These chemokines are then degraded while the receptor recycles to the cell surface. Interestingly, D6-mediated chemokine internalization occurs without bringing about a reduction in cell surface D6 levels. This is possible because unlike CCR5, D6 is predominantly localized in recycling endosomes capable of trafficking to and from the cell surface in the absence of ligand. When chemokine is present, it can enter the cells associated with D6 already destined for internalization. By this mechanism, D6 can target chemokines for degradation without the necessity for cell signaling, and without desensitizing the cell to subsequent chemokine exposure.


Figures

Figure 1.
Figure 1.
125I-mCCL3 is internalized by D6 without reducing surface receptor levels. (A) Cells were preloaded with 125I-mCCL3 at 4°C, washed, and shifted to 37°C, and internalization was determined by the ratio of acid resistant- to acid-sensitive radioactivity associated with the cell pellet. Data are representative of three repeats, with each point done in triplicate. (B) Cells were incubated with 200 nM mCCL3 at 37°C, and receptor levels were assessed by flow cytometry by using α-D6 or α-CCR5 antibodies. Each time point was done in triplicate, and mean fluorescence intensity readings were compared with cells that did not receive mCCL3, but otherwise underwent the same protocol. Untransfected HEK293 cells were used as a negative control, and their mean fluorescence readings subtracted from all transfected cell data. (C) Synchronized ligand internalization. Cells were preloaded with or without 200 nM mCCL3 at 4°C, shifted to 37°C, and receptor levels assessed by flow cytometry. (D) Cells were incubated with or without 200 nM hCCL3-L1 for 45 min at 37°C, washed, and then incubated in the presence of 6 nM 125I-hCCL3-L1 at 37°C for the given time. Cell-associated radioactivity was determined. Data are presented as a percentage of radioligand internalized by hCCL3-L1 pretreated cells compared with those receiving no hCCL3-L1 pretreatment. Each point was done in triplicate and the experiment repeated three times, with a representative example shown.
Figure 2.
Figure 2.
D6 is found predominantly inside the cell. (A) Autoradiograph of Western blot, revealed with α-D6 antibodies, of known quantities of purified D6 and lysate from 105 HA-D6-expressing HEK293 cells. Size of bands (in kilodaltons) is indicated to the left, as determined by the position of molecular weight markers ran adjacent to the samples shown. (B) Immunofluorescence analysis of paraformaldehyde-fixed HA-D6–expressing HEK293 cells by using α-D6 revealed with a TRITC-coupled α-mouse IgG secondary (red). The nucleus (blue) is revealed using DAPI. (C and D) Representative images of live HEK293 cells stably expressing either CCR5-GFP (C) or D6-GFP (D). Bar (B–D), 20 μm. (E) Immunohistochemical staining of LECs in a paraffin-embedded section of human tonsil, with α-D6 revealed enzymatically using peroxidase-coupled secondary reagents to give a brown-red stain. Nuclei are stained with hematoxylin. The lumen of this flattened lymphatic vessel is indicated by the dotted line. Bar, 10 μm.
Figure 3.
Figure 3.
D6 localizes to the early/recycling endosomal compartment. Paraformaldehyde-fixed HEK293 expressing D6-GFP (green) were permeabilized with 0.05% saponin and incubated with antibodies to CD63 (A), rab5 (B), or transferrin receptor (TfR) (C), which were then visualized using Cy3-coupled α-mouse IgG antibodies (red). Confocal microscopy was used to generate consecutive images to localize D6-GFP and Cy3, which were then superimposed, giving yellow upon colocalization. In B and C, the white boxes on the overlaid image correspond to the position of the close-up image shown to the right. Nuclei were revealed with DAPI. Bar on the overlaid images, 20 μm.
Figure 4.
Figure 4.
D6-GFP internalizes α-D6 antibodies in the absence of chemokine. HEK293 cells expressing D6-GFP (green) were loaded at 4°C with α-D6 antibodies, washed, and then either immediately fixed (top row) or shifted to 37°C for 5 (middle row) or 15 min (bottom row) before fixation. Cells were then permeabilized in 0.05% saponin, and the location of the α-D6 was visualized with Cy3-coupled α-mouse IgG antibodies (red). Confocal microscopy was used to generate consecutive images to localize D6-GFP and Cy3, which were then superimposed (overlay, yellow indicating colocalization). The white boxes on the overlaid image correspond to the position of the close-up image shown to the right. Nuclei were revealed with DAPI. Bar on the overlaid images, 20 μm.
Figure 5.
Figure 5.
CCR5-GFP requires ligand to undergo significant receptor and antibody internalization. HEK293 cells expressing CCR5-GFP (green) were loaded at 4°C with α-CCR5 antibodies, washed, and then either immediately fixed (images in A) or shifted to 37°C for 5 (B, top row) or 10 min (B, bottom row) in the presence or absence of 200 nM mCCL3, before fixation. Cells were then permeabilized in 0.05% saponin, and the location of the α-CCR5 was visualized with Cy3-coupled α-mouse IgG antibodies (red). Confocal microscopy was used to generate consecutive images to localize CCR5-GFP and Cy3, which were then superimposed (overlay, yellow indicating colocalization). Nuclei were revealed with DAPI. Bar on the overlaid images, 20 μm.
Figure 6.
Figure 6.
Internalized α-D6 antibodies recycle back to the cell surface. (A) Confocal microscopy. HEK293 cells expressing D6-GFP were loaded at 37°C for 60 min with α-D6 antibodies, surface antibody removed by acid washing, and the cells then incubated at 37°C with Cy3-coupled α-mouse IgG antibodies (red) for 60 min. Cells were then fixed and confocal microscopy used to generate consecutive images to localize D6-GFP and Cy3, which were then superimposed. Nuclei were revealed with DAPI. Bar on the overlaid images, 20 μm. (B) Flow cytometry. HEK293 cells expressing HA-D6 were loaded at 37°C for 60 min with α-D6 antibodies, surface antibody removed by acid washing where indicated, and the cells then incubated at 37°C (black columns) or 4°C (hatched columns) with PE-coupled α-mouse IgG antibodies for the time specified beneath the graph. Alternatively (white column, labeled 4°C control), cells were loaded at 4°C for 60 min with α-D6 antibodies, washed with PBS, and then incubated at 4°C with PE-coupled α-mouse IgG antibodies. For all samples, after a final wash, cells were subjected to flow cytometric analysis and mean fluorescence intensity values were determined. Each point was done in triplicate, and data are representative of repeated data sets.
Figure 7.
Figure 7.
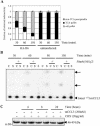
CCL3 internalized by D6 is degraded by an NH4Cl-sensitive pathway. (A and B) HA-D6 transfectants, or untransfected HEK293 cell controls, were loaded at 4°C with 125I-mCCL3, washed, shifted to 37°C for the specified time, and the cell pellet and supernatant were harvested. Where indicated, NH4Cl (50 mM) was present throughout the experiment. (A) Supernatant was subjected to TCA precipitation. Radioactivity associated with the TCA pellet, the non-TCA precipitable fraction, and the cells themselves was counted and is presented as a percentage of the total retrieved radioactivity for HA-D6 and untransfected cells. Samples at each time point were done in triplicate. Repeat experiments gave similar data sets. (B) Ligand fate in HA-D6 cells. Matched samples of cell lysate (∼12.5% of total) (labeled C) or supernatant (∼4% of total) (labeled S) were run on SDS-polyacrylamide gels adjacent to samples in which no cells were included (labeled 0). Gels were dried onto filter paper and exposed to x-ray film. Intact 125I-mCCL3 is marked with an arrowhead, and high-mobility smeared bands are marked with arrows. (C) α-D6-probed Western blot of aliquots of cell lysates made from 5 × 10⁶ HA-D6-expressing HEK293 cells treated for the given times in 20 ml of medium containing mCCL3 (200 nM) and CHX (20 μg/ml) where indicated. Arrow to the right of the panel indicates the apparent molecular weight calculated from the positions of protein markers electrophoresed adjacent to the samples.
Figure 8.
Figure 8.
125I-hCCL3-L1 internalized by D6, in contrast to CCR5, is rapidly degraded and cannot be “washed” from the cells with unlabeled hCCL3-L1. (A) Top, cells expressing HA-D6 or HA-CCR5 were surface loaded at 4°C for 1 h in the presence of 12 nM 125I-hCCL3-L1, washed, and shifted to 37°C. At the given time points after temperature shift, cells were spun out, and the supernatant was subjected to TCA precipitation. Radioactivity associated with the TCA pellet, the non-TCA precipitable fraction, and the cells themselves was counted and is presented as a percentage of the total retrieved radioactivity. Samples at each time point were done in triplicate. Bottom, cell lysates from the experiment depicted in the top panel were subjected to SDS-PAGE. The gel was dried and exposed to x-ray film, and an autoradiograph is shown. The position of intact 125I-hCCL3-L1 is indicated. (B) HEK293 cells expressing HA-D6 (top) or HA-CCR5 (bottom), preloaded with 125I-hCCL3-L1, were washed and shifted to 37°C in the presence or absence of 200 nM unlabeled hCCL3-L1 (as indicated under each graph). At the given time points, cells were spun out and the supernatant was subjected to TCA precipitation. Radioactivity associated with the TCA pellet, the non-TCA precipitable fraction, and the cells themselves was counted and is presented as a percentage of the total retrieved radioactivity. Samples at each time point were done in triplicate. (C) HEK293 cells expressing HA-D6 (top) or HA-CCR5 (bottom) were subjected to the same analysis described in B, except that 50 mM NH4Cl was added to some samples where indicated throughout the incubations. The presence of 200 nM hCCL3-L1 is indicated along with the time of incubation at 37°C. Samples at each time point were done in triplicate.
Figure 9.
Figure 9.
125I-hCCL3-L1 interactions with CCR5 and D6 show opposing sensitivities to reduced pH. HEK293 cells expressing HA-D6 or HA-CCR5 were loaded at 4°C with 125I-hCCL3-L1 and then washed for the indicated time at 4°C with buffered 293 medium set to pH 5, 6, or 7 with HCl. Remaining radioactivity was compared with radioligand-loaded cells washed briefly in ice-cold PBS. Each point shows the mean ± SD of results from three identically treated samples.
Figure 10.
Figure 10.
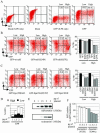
CCL3 uptake via D6 is reduced by genetic modulation of the activity of rab5, Eps15, or dynamin I, but not β-arrestin-1. (A–C) Controls and rab5 and Eps15 data. Representative flow cytometric profiles of HA-D6-expressing HEK293 cells transiently transfected with constructs expressing the proteins given underneath each plot. Mock transfected cells are labeled Mock. Twenty-four hours after transfection, cells were harvested and incubated with Bio-CCL3/S-PE (or S-PE only where indicated), for 1 h at 37°C, washed, and data were collected for GFP expression and PE uptake. (A) Controls, i.e., mock-transfected and untagged GFP-transfected cells. Gates of low and high expressers were selected and further separated into those +ve or –ve for PE uptake based on controls like these. (B and C) Data from HA-D6–expressing HEK293 cells transfected with rab5 or Eps15 constructs, respectively. The graphs on the right-hand side of B and C show the mean percentage of PE+ cells (±SD) from four identically treated samples. Repeat experiments produced similar data sets. (D) GFP control transfection. Expression of GFP, determined by flow cytometry, in HA-D6 cells transiently transfected with 1–3 μg of pEGFP-N2. The nonexpresser gate was set using mock-transfected HA-D6 cells. GFP+ cells were split into high expressers (white bars) and low expressers (black bars) arbitrarily, by dividing the remaining region of the plot into two regions of equal size (according to the FL1 logarithmic axis). (E) Western blot analysis of lysates from β-arrestin-1 (V53D) or dynamin I (K44A) transfectants. Cell lysates were prepared from aliquots of the cells used in F, subjected to SDS-PAGE, and Western blots prepared. β-Arrestin-1 or dynamin I proteins were visualized by chemiluminescence, by using antibodies against these proteins and appropriate secondary reagents. The antibody used, and the estimated molecular weight of the protein detected, is given under each autoradiograph. (F) Impact of expression of β-arrestin-1 (V53D) or dynamin I (K44A) on BioCCL3/S-PE uptake. HA-D6 cells were transiently transfected with the quantity and type of plasmid indicated beneath the graph. Twenty-four hours later, cells were assessed for Bio-CCL3/S-PE uptake (1-h incubation). Mean fluorescence intensity (MFI) of cell-associated PE was determined by flow cytometry in test samples and is presented as a percentage (mean ± SD from four replicates) of the MFI seen in HA-D6 cells transiently transfected with a similar quantity of pEGFP-N2 plasmid, and that had been similarly treated for Bio-CCL3/S-PE uptake. On repeat, a similar data set was observed.

References

    1. Alcami, A. (2003). Viral mimicry of cytokines, chemokines and their receptors. Nat. Rev. Immunol. 3, 36–50. - PubMed
    1. Bacon, K., et al. (2002). Chemokine/chemokine receptor nomenclature. J. Interferon Cytokine Res. 22, 1067–1068. - PubMed
    1. Barlic, J., et al. (1999). β-arrestins regulate interleukin-8-induced CXCR1 internalization. J. Biol. Chem. 274, 16287–16294. - PubMed
    1. Benmerah, A., Bayrou, M., Cerf-Bensussan, N., and Dautry-Varsat, A. (1999). Inhibition of clathrin-coated pit assembly by an Eps15 mutant. J. Cell Sci. 112, 1303–1311. - PubMed
    1. Benmerah, A., Lamaze, C., Begue, B., Schmid, S.L., Dautry-Varsat, A., and Cerf-Bensussan, N. (1998). AP-2/Eps15 interaction is required for receptor-mediated endocytosis. J. Cell Biol. 140, 1055–1062. - PMC - PubMed

Publication types

MeSH terms

LinkOut - more resources