Comparative Study
. 2004 Mar 16;43(10):2792-803.
doi: 10.1021/bi035830e.

Microtubule-kinesin interface mutants reveal a site critical for communication

Affiliations
Comparative Study

Microtubule-kinesin interface mutants reveal a site critical for communication

Lisa M Klumpp et al. Biochemistry. .

Abstract

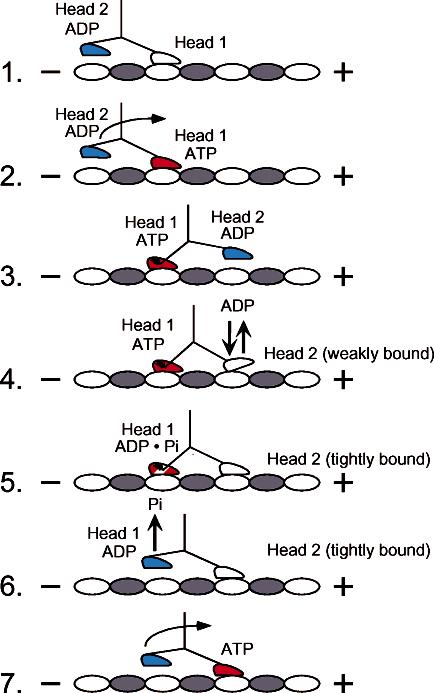
Strict coordination of the two motor domains of kinesin is required for driving the processive movement of organelles along microtubules. Glutamate 164 of the kinesin heavy chain was shown to be critical for kinesin function through in vivo genetics in Drosophila melanogaster. The mutant motor E164K exhibited reduced steady-state ATPase activity and higher affinity for both ATP and microtubules. Moreover, an alanine substitution at this position (E164A) caused similar defects. It became stalled on the microtubule and was unable to bind and hydrolyze ATP at the second motor domain. Glu(164), which has been conserved through evolution, is located at the motor-microtubule interface close to key residues on helix alpha12 of beta-tubulin. We explored further the contributions of Glu(164) to motor function using several site-directed mutant proteins: E164K, E164N, E164D, E164Q, and D165A. The results indicate that the microtubule-E164K complex can only bind and hydrolyze one ATP. ATP with increased salt was able to dissociate a population of E164K motors from the microtubule but could not dissociate E164A. We tested the basis of the stabilized microtubule interaction with E164K, E164N, and E164A. The results provide new insights about the motor-microtubule interface and the pathway of communication for processive motility.


Figures

FIGURE 1
FIGURE 1
Alternating site model for kinesin stepping. The cycle begins as head 1 binds the microtubule with rapid ADP release. ATP binding at head 1 leads to the plus-end-directed motion of the neck linker to position head 2 forward at the next microtubule binding site. ATP binding at head 1 is sufficient to promote head 2 association with the microtubule followed by rapid ADP release. ATP hydrolysis at head 1 promotes tight binding of head 2 onto the microtubule, resulting in an intermediate with both heads strongly bound to the microtubule and with the neck linkers under mechanical strain. Phosphate is released, and the rearward head detaches from the microtubule. The active site of head 2 is now accessible for ATP binding, and the cycle is repeated.
FIGURE 2
FIGURE 2
Docking model of the microtubule,kinesin complex. The potential interactions of Drosophila Glu164 (rat Glu158) at the β-sheet 5a/loop 8b junction with microtubule amino acids were explored by docking the coordinates of monomeric kinesin 2KIN (9) and α,β-tubulin (53) into the electron density map of microtubule·kinesin complexes obtained by cryo-EM (54). The kinesin motor domain is shown in red with R-tubulin in green. The β-tubulin subunit is shown in cyan with Taxol (yellow) bound, and the plus end of the microtubule is to the right. The neck linker (magenta) follows kinesin helix R6 and is shown docked onto the catalytic core and pointed toward the plus end of the microtubule. Note that Glu415, Met416, Glu417, and Phe418 are β-tubulin residues on helix α12 in close proximity to kinesin Glu164. Arg292 (human R284, rat R286) of kinesin helix α5 has been implicated in interactions with β-tubulin helix β12 as well as Glu164 (48, 49). The lower panels present the stereoview.
FIGURE 3
FIGURE 3
Acid quench kinetics of ATP hydrolysis. A preformed Mt·E164K complex (5 μM E164K, 18 μM tubulin) was rapidly mixed with varying concentrations of [α-32P]MgATP in a chemical quench-flow instrument. (A) Transients for ATP hydrolysis in the presence of 10 μM (●), 20 μM (▲), 30 μM (○), 50 μM (△), and 200 μM (×) [α-32P]MgATP. The data were fit to eq 4. Only the first 100 ms of each transient is shown to expand the time domain of the initial, exponential burst phase. (B) The rate constants of the pre-steady-state burst phase determined for each transient in panel A were plotted as a function of [α-32P]MgATP concentration. The fit of the data to a hyperbola provides the maximum rate constant for the burst phase, kb) 187 ± 12 s-1 and Kd,ATP) 27 ± 7 μM. (C) The amplitudes of the pre-steady-state burst phase determined from each transient in panel A were plotted as a function of [α-32P]MgATP concentration. The data were fit to a hyperbola with 1.04 ± 0.2 μM as the maximum burst amplitude and Kd,ATP ) 82 ± 41 μM. Panels B and C include additional data obtained from experiments not shown in (A).
FIGURE 4
FIGURE 4
Pre-steady-state kinetics of ATP binding and hydrolysis. A preformed Mt·E164K complex (5 μM E164K, 18 μM tubulin) was rapidly mixed with [α-32P]MgATP followed by either an acid quench or a 5 mM MgATP chase. The reaction times varied from 5 to 400 ms with the first 100 ms shown. The concentrations reported represent final concentrations. The time courses for ATP binding (▲) and ATP hydrolysis (●) were determined for two different [α-32P]MgATP concentrations (A, 20 μM; B, 50 μM).
FIGURE 5
FIGURE 5
Pulse-chase kinetics of ATP binding. A preformed Mt·E164K complex (5 μM E164K, 18 μM tubulin) was rapidly mixed with varying concentrations of [α-32P]MgATP in a chemical quench-flow instrument, and the reaction times were varied from 5 to 400 ms followed by a 5 mM MgATP chase. The data were fit to eq 4. (A) Transients for ATP binding in the presence of 10 μM (●), 20 μM (▲), 30 μM (○), 50 μM (△), and 200 μM (×) [α-32P]-MgATP. (B) The rate constants of the pre-steady-state burst phase determined from each transient in (A) were plotted as a function of [α-32P]MgATP concentration. The fit of the data to a hyperbola provides the maximum rate constant, kb) 286 ± 31 s-1 and Kd,ATP) 19 ± 7 μM. (C) The amplitudes of the pre-steady-state burst phase determined from each transient in (A) were plotted as a function of [α-32P]MgATP concentration. The data were fit to a hyperbola with 1.6 ±0.1 μM as the maximum burst amplitude and Kd,ATP) 40 ±8 μM.
FIGURE 6
FIGURE 6
Dissociation kinetics of E164 mutants. A preformed Mt·E164 mutant complex (3 μM mutant, 2.9 μM tubulin, 20 μM Taxol) was rapidly mixed in the stopped-flow instrument with 1 mM MgATP plus 100 mM KCl, and a change in turbidity was monitored. Each transient was normalized to start at 0.14 V. There is an initial rapid drop in each transient during the first 3 ms that is attributed to mixing. Therefore, to fit the data and obtain amplitude information, the dissociation signal was considered to begin at 0.125 V. Note the variability in the amplitude of the transients, representing differences in motor detachment from the microtubule.
FIGURE 7
FIGURE 7
MantADP release from head 2 initiated by ATP. The preformed Mt·E164K complex (6 μM E164K, 3 μM mantADP, 15 μM tubulin) was rapidly mixed in the stopped-flow instrument with varying concentrations of ATP (3.125-500 μM). (A) Transients are shown for the following concentrations of MgATP: 3.125, 6.25, 12.5, 25, and 100 μM (from the top to the bottom transient). Fluorescence signals were normalized to begin at 6.42 V for each MgATP concentration. The smooth lines represent the fit of the data to a single exponential function. (B) The observed exponential rate constants of the MgATP-dependent fluorescence change increased as a function of MgATP concentration. The data were fit to a hyperbola which defines the maximum rate of mantADP release from the second head activated by ATP to be 32.8 ± 0.7 s-1.
FIGURE 8
FIGURE 8
MantADP release from head 2 initiated by ADP. (A) The preformed Mt±E164K complex (6 μM E164K, 3 μM mant-ADP, 15 μM tubulin) was rapidly mixed in the stopped-flow instrument with varying concentrations of MgADP (10-1000 μM). Transients are shown for the following concentrations of MgADP: 12.5, 25, 50, and 100 μM (from the top to the bottom trace). Fluorescence signals were normalized to begin at 5.5 V for each MgADP concentration. The smooth lines represent the fit of the data to two exponential functions. (B) The initial exponential rates of the MgADP-dependent fluorescence change increased as a function of MgADP concentration. The fit of the data to a hyperbola provided the maximum rate constant of mantADP release from the second head, kobs) 22.1 ± 0.7 s-1. (C) The preformed Mt·E164K complex (6 μM E164K, 3 μM mantADP) was rapidly mixed in the stopped flow with 1 mM MgATP (purple, bottom transient), MgADP (green), MgATPγS (red), or MgAMP-PNP (blue). Fluorescence signals were normalized to begin at 1 V, and the smooth lines represent the fit of the data to a single exponential function. The rate of mantADP release from the high-affinity site (head 2) was 33.9 ±0.5 s-1 initiated by MgATP, 19.9 ±0.3 s-1 by MgADP, 19.9 ±0.3 s-1 by MgATPγS, and 17.1 ±0.3 s-1 by MgAMP-PNP.
Scheme 1
Scheme 1

References

    1. Vale RD, Milligan RA. The way things move: Looking under the hood of molecular motor proteins. Science. 2000;288:88–95. - PubMed
    1. Schief WR, Howard J. Conformational changes during kinesin motility. Curr. Opin. Cell Biol. 2001;13:19–28. - PubMed
    1. Schliwa M, Woehlke G. Molecular motors. Nature. 2003;422:759–765. - PubMed
    1. Mandelkow E, Johnson KA. The structural and mechanochemical cycle of kinesin. Trends Bochem. Sci. 1998;23:429–433. - PubMed
    1. Kull FJ, Sablin EP, Lau R, Fletterick RJ, Vale RD. Crystal structure of the kinesin motor domain reveals a structural similarity to myosin. Nature. 1996;380:550–555. - PMC - PubMed

Publication types

MeSH terms

LinkOut - more resources