

A molecular timescale of eukaryote evolution and the rise of complex multicellular life
- PMID: 15005799
- PMCID: PMC341452
- DOI: 10.1186/1471-2148-4-2
A molecular timescale of eukaryote evolution and the rise of complex multicellular life
Abstract
Background: The pattern and timing of the rise in complex multicellular life during Earth's history has not been established. Great disparity persists between the pattern suggested by the fossil record and that estimated by molecular clocks, especially for plants, animals, fungi, and the deepest branches of the eukaryote tree. Here, we used all available protein sequence data and molecular clock methods to place constraints on the increase in complexity through time.
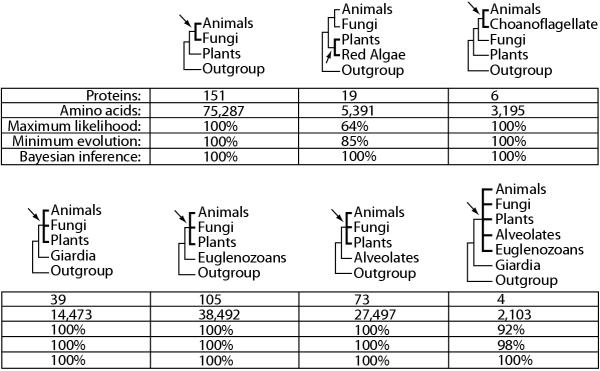
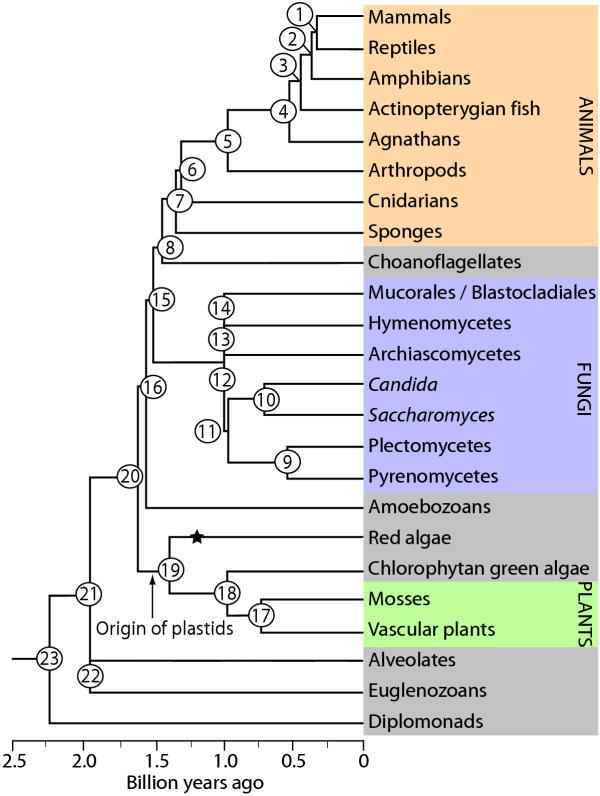
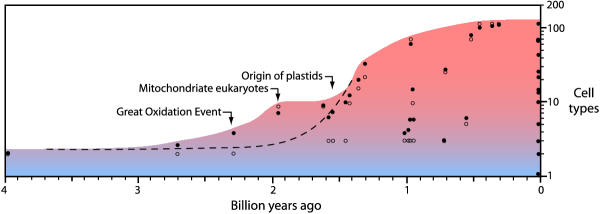
Results: Our phylogenetic analyses revealed that (i) animals are more closely related to fungi than to plants, (ii) red algae are closer to plants than to animals or fungi, (iii) choanoflagellates are closer to animals than to fungi or plants, (iv) diplomonads, euglenozoans, and alveolates each are basal to plants+animals+fungi, and (v) diplomonads are basal to other eukaryotes (including alveolates and euglenozoans). Divergence times were estimated from global and local clock methods using 20-188 proteins per node, with data treated separately (multigene) and concatenated (supergene). Different time estimation methods yielded similar results (within 5%): vertebrate-arthropod (964 million years ago, Ma), Cnidaria-Bilateria (1,298 Ma), Porifera-Eumetozoa (1,351 Ma), Pyrenomycetes-Plectomycetes (551 Ma), Candida-Saccharomyces (723 Ma), Hemiascomycetes-filamentous Ascomycota (982 Ma), Basidiomycota-Ascomycota (968 Ma), Mucorales-Basidiomycota (947 Ma), Fungi-Animalia (1,513 Ma), mosses-vascular plants (707 Ma), Chlorophyta-Tracheophyta (968 Ma), Rhodophyta-Chlorophyta+Embryophyta (1,428 Ma), Plantae-Animalia (1,609 Ma), Alveolata-plants+animals+fungi (1,973 Ma), Euglenozoa-plants+animals+fungi (1,961 Ma), and Giardia-plants+animals+fungi (2,309 Ma). By extrapolation, mitochondria arose approximately 2300-1800 Ma and plastids arose 1600-1500 Ma. Estimates of the maximum number of cell types of common ancestors, combined with divergence times, showed an increase from two cell types at 2500 Ma to approximately 10 types at 1500 Ma and 50 cell types at approximately 1000 Ma.
Conclusions: The results suggest that oxygen levels in the environment, and the ability of eukaryotes to extract energy from oxygen, as well as produce oxygen, were key factors in the rise of complex multicellular life. Mitochondria and organisms with more than 2-3 cell types appeared soon after the initial increase in oxygen levels at 2300 Ma. The addition of plastids at 1500 Ma, allowing eukaryotes to produce oxygen, preceded the major rise in complexity.
Figures
References
-
- Bonner JT. The evolution of complexity by means of natural selection. Princeton, New Jersey, Princeton University Press; 1988.
-
- Valentine JW, Collins AG, Meyer CP. Morphological complexity increase in metazoans. Paleobiology. 1994;20:131–142.
-
- Bell G, Mooers AO. Size and complexity among multicellular organisms. Biological Journal of the Linnean Society. 1997;60:345–363. doi: 10.1006/bijl.1996.0108. - DOI
-
- McShea DW. The hierarchical structure of organisms: a scale and documentation of a trend in the maximum. Paleobiology. 2001;27:405–423.
-
- Ward PD, Brownlee D. Rare Earth. New York, Copernicus; 2000. p. 333.
Publication types
MeSH terms
Substances
LinkOut - more resources
Full Text Sources
Other Literature Sources
