. 2004 Mar;70(3):1506-13.
doi: 10.1128/AEM.70.3.1506-1513.2004.

Optimization of procedures for counting viruses by flow cytometry

Affiliations

Optimization of procedures for counting viruses by flow cytometry

Corina P D Brussaard. Appl Environ Microbiol. 2004 Mar.

Abstract

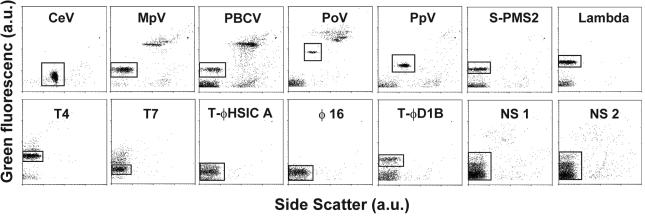
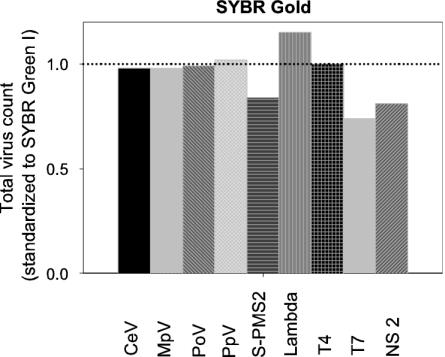
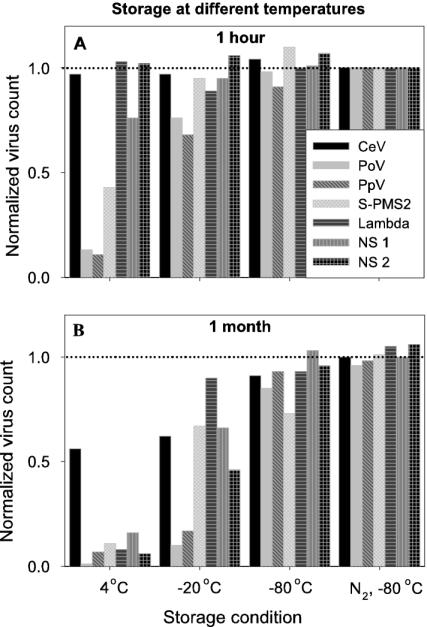
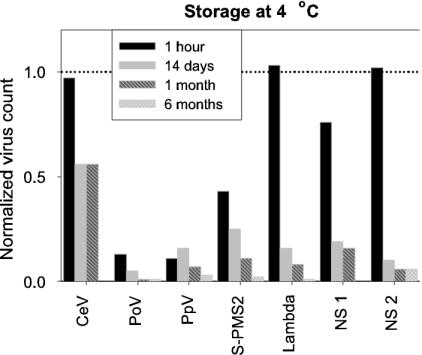
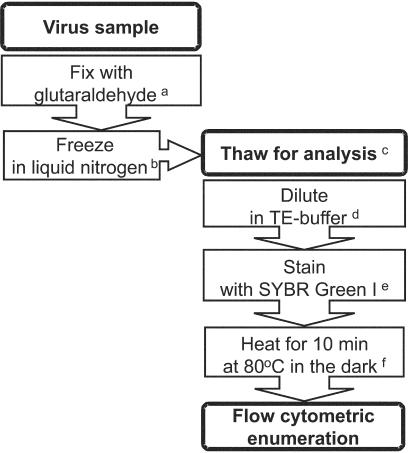
The development of sensitive nucleic acid stains, in combination with flow cytometric techniques, has allowed the identification and enumeration of viruses in aquatic systems. However, the methods used in flow cytometric analyses of viruses have not been consistent to date. A detailed evaluation of a broad range of sample preparations to optimize counts and to promote the consistency of methods used is presented here. The types and concentrations of dyes, fixatives, dilution media, and additives, as well as temperature and length of incubation, dilution factor, and storage conditions were tested. A variety of different viruses, including representatives of phytoplankton viruses, cyanobacteriophages, coliphages, marine bacteriophages, and natural mixed marine virus communities were examined. The conditions that produced optimal counting results were fixation with glutaraldehyde (0.5% final concentration, 15 to 30 min), freezing in liquid nitrogen, and storage at -80 degrees C. Upon thawing, samples should be diluted in Tris-EDTA buffer (pH 8), stained with SYBR Green I (a 5 x 10(-5) dilution of commercial stock), incubated for 10 min in the dark at 80 degrees C, and cooled for 5 min prior to analysis. The results from examinations of storage conditions clearly demonstrated the importance of low storage temperatures (at least -80 degrees C) to prevent strong decreases (occasionally 50 to 80% of the total) in measured total virus abundance with time.


Figures

FIG. 1.
FIG. 1.
Cytograms (4 decades log scale) of green fluorescence versus side scatter (arbitrary units, a.u.) for 12 different virus cultures (see Materials and Methods) and two natural virus samples (NS 1 and 2) tested under reference conditions (glutaraldehyde fixed at 0.5% final concentration, frozen in liquid nitrogen, diluted in TE-buffer pH 8, stained for 10 min at 80°C with SYBR Green I at a final dilution of 5 × 10⁻⁵ the commercial stock). At least 2000 events are plotted for each virus type, except for NS 1 and 2, for which 5000 events were plotted. The windows mark the selected regions for analysis, and contain the viruses of interest. Total virus counts were obtained by correcting the total counts for noise (which typically has the lowest green fluorescence) with sterile and filtered (0.2 μm pore-size) seawater or medium as blank.
FIG. 2.
FIG. 2.
Total virus counts obtained after staining with SYBR Gold (final dilution of 5 × 10⁻⁵ the commercial stock). The data were corrected for blanks and normalized to SYBR Green I at an identical dye concentration (dotted line). NS 2 represents a natural virus sample.
FIG. 3.
FIG. 3.
Effect of storage temperatures on virus abundance. Fixed virus samples (glutaraldehyde at 0.5% final concentration) were stored at 4°C, −20°C, and −80°C (directly or after having been deep frozen in liquid nitrogen, N2, prior to storage). Samples were analyzed after 1 h (A) and 1 month (B). Total virus counts were corrected for blanks and normalized to samples frozen in liquid nitrogen and directly analyzed (dotted line). NS 1 and 2 represent natural virus samples.
FIG. 4.
FIG. 4.
Effect of storage at 4°C on measured virus abudance (fixed with glutaraldehyde at 0.5% final concentration). Samples were stored for 1 h, 14 days, 1 month, and 6 months. Total virus counts were corrected for blanks and normalized to samples frozen in liquid nitrogen and directly analyzed (dotted line). The samples for CeV at 6 months were lost. NS 1 and 2 represent natural virus samples.
FIG. 5.
FIG. 5.
Schematic overview of the optimal protocol for counting of viruses in solution. Superscript letters: a, 0.5% final concentration; b, store sample at temperatures below −80°C; c, work fast once samples are thawed since total virus count decreases with time; d, TE buffer at pH 8 and avoid low dilution factors (<10); e, final dilution SYBR Green I of 5 × 10⁻⁵ the commercial stock; f, allow sample to cool down for 5 min in the dark before analysis.

Similar articles

Cited by

References

    1. Bergh, Ø., K. Y. Børsheim, G. Bratbak, and M. Heldal. 1989. High abundance of viruses found in aquatic environments. Nature 340:467-468. - PubMed
    1. Bettarel, Y., T. Sime-Ngando, C. Amblard, and H. Laveran. 2000. A comparison of methods for counting viruses in aquatic systems. Appl. Environ. Microbiol. 66:2283-2289. - PMC - PubMed
    1. Børsheim, K. Y., G. Bratbak, and M. Heldal. 1990. Enumeration and biomass estimation of planktonic bacteria and viruses by transmission electron microscopy. Appl. Environ. Microbiol. 56:352-356. - PMC - PubMed
    1. Bratbak, G., J. K. Egge, and M. Heldal. 1993. Viral mortality of the marine alga Emiliania huxleyi (Haptophyceae) and termination of algal blooms. Mar. Ecol. Prog. Ser. 93:39-48.
    1. Bratbak, G., M. Heldal, S. Norland, and F. Thingstad. 1990. Viruses as partners in spring bloom microbial trophodynamics. Appl. Environ. Microbiol. 56:1400-1405. - PMC - PubMed

Publication types

LinkOut - more resources