. 2004 Mar 15;164(6):911-21.
doi: 10.1083/jcb.200308103. Epub 2004 Mar 8.

Keratins modulate colonocyte electrolyte transport via protein mistargeting

Affiliations

Keratins modulate colonocyte electrolyte transport via protein mistargeting

Diana M Toivola et al. J Cell Biol. .

Abstract

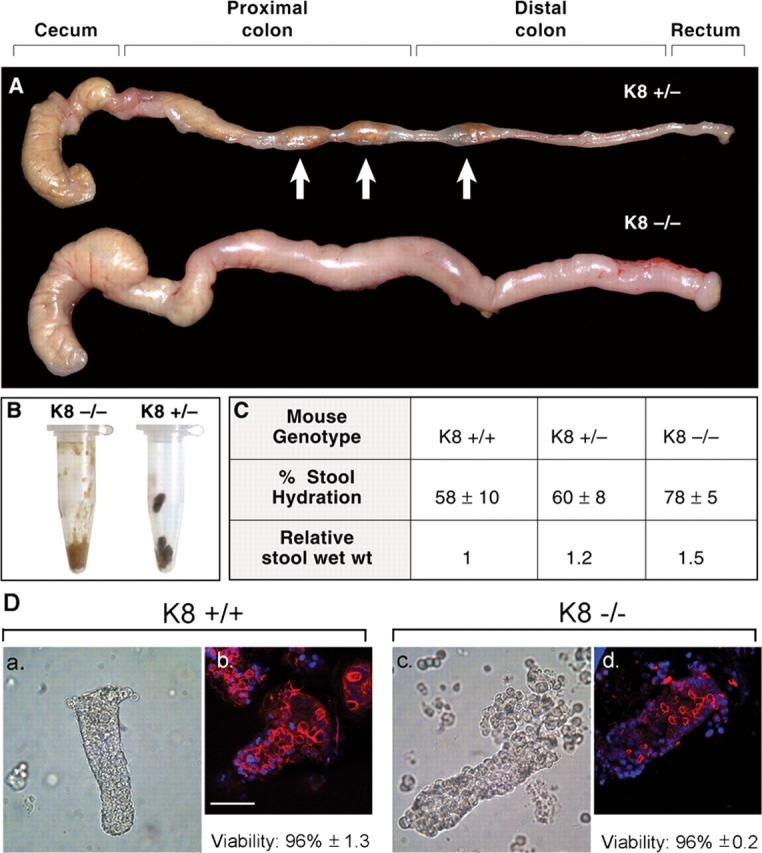
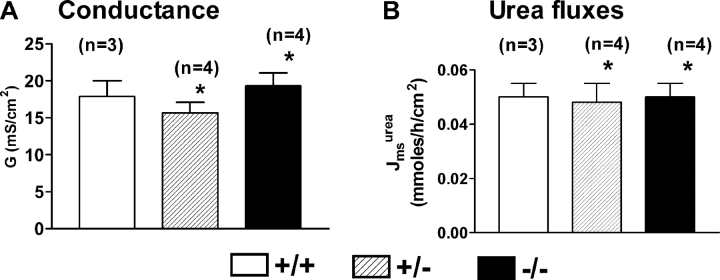
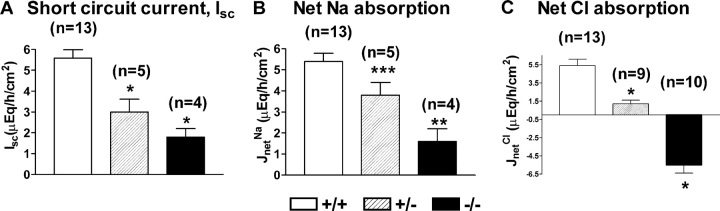
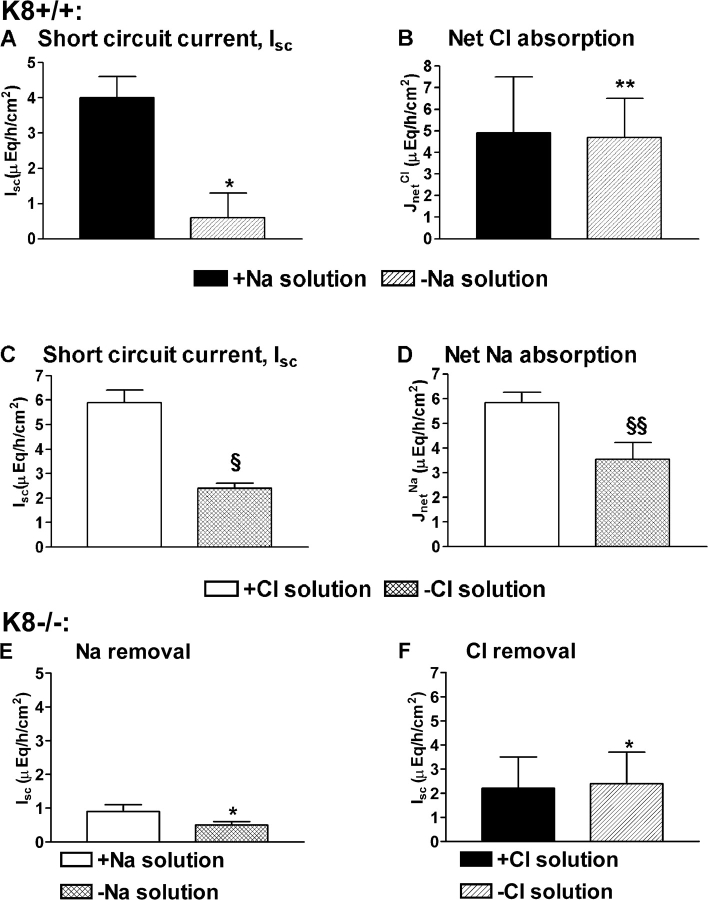
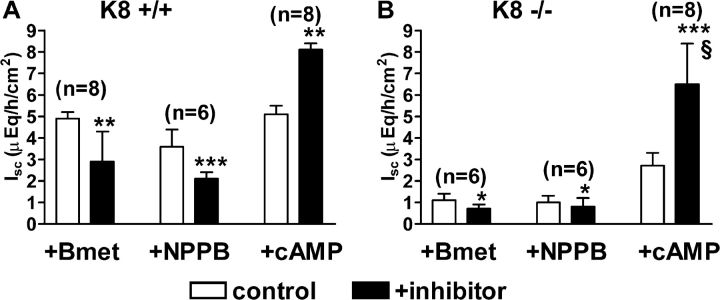
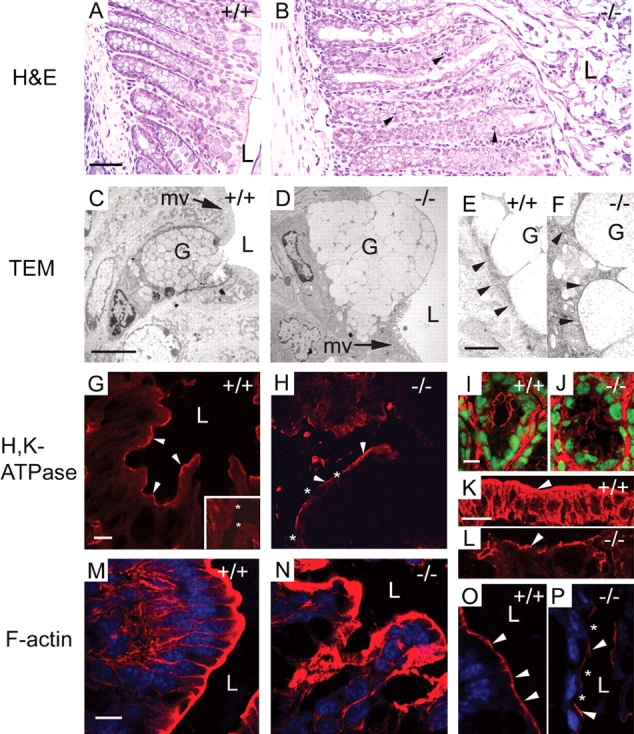
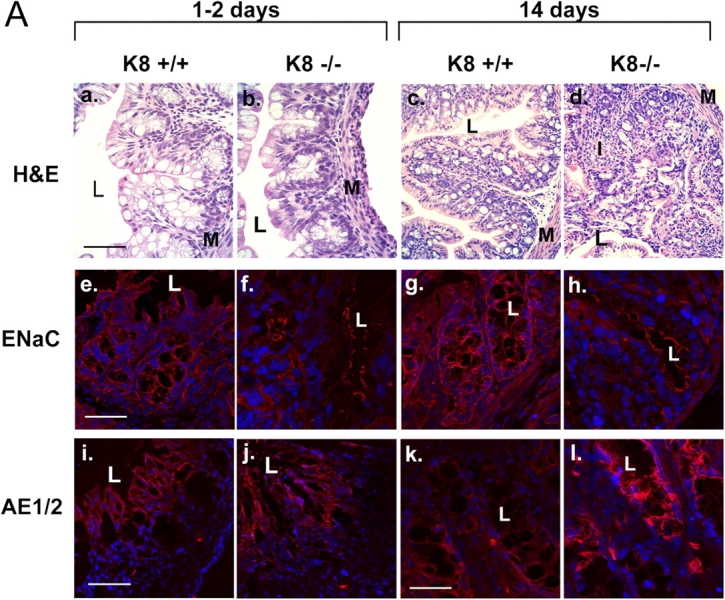
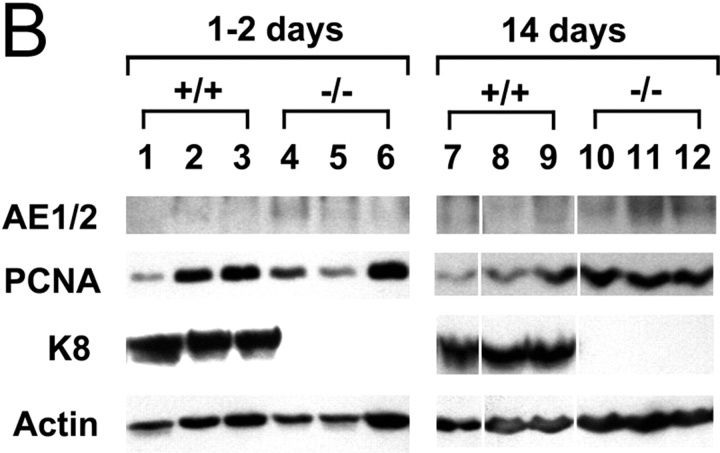
The function of intestinal keratins is unknown, although keratin 8 (K8)-null mice develop colitis, hyperplasia, diarrhea, and mistarget jejunal apical markers. We quantified the diarrhea in K8-null stool and examined its physiologic basis. Isolated crypt-units from K8-null and wild-type mice have similar viability. K8-null distal colon has normal tight junction permeability and paracellular transport but shows decreased short circuit current and net Na absorption associated with net Cl secretion, blunted intracellular Cl/HCO3-dependent pH regulation, hyperproliferation and enlarged goblet cells, partial loss of the membrane-proximal markers H,K-ATPase-beta and F-actin, increased and redistributed basolateral anion exchanger AE1/2 protein, and redistributed Na-transporter ENaC-gamma. Diarrhea and protein mistargeting are observed 1-2 d after birth while hyperproliferation/inflammation occurs later. The AE1/2 changes and altered intracellular pH regulation likely account, at least in part, for the ion transport defects and hyperproliferation. Therefore, colonic keratins have a novel function in regulating electrolyte transport, likely by targeting ion transporters to their cellular compartments.


Figures

Figure 1.
Figure 1.
Gross colonic morphology and stool characterization of K8 mouse genotypes. (A) The entire colon from cecum to rectum was excised from K8+/− and K8−/− mice. Note the thicker K8−/− colon compared with the K8+/− colon (which is identical to K8+/+) through which stool pellets (arrows) can be seen. (B) K8−/− stool is loose as compared with K8+/− stool pellets. (C) Percent stool hydration ± SD and relative stool wet weight (normalized to K8+/+). P < 0.0001 (K8−/− vs. WT); P < 0.0002 (K8−/− vs. K8+/−) when comparing stool percent hydration. (D) Colonocytes/crypt-units were isolated from K8+/+ (a and b) and K8−/− (c and d) colon and shown as phase contrast images (a and c) or after immunostaining for K8/18 (red) and nuclei (blue; b and d). Viability was determined by measuring the percent of LDH leakage and is given as average of three experiments ± SD. Bar, 50 μm (for b and d).
Figure 2.
Figure 2.
Conductance and paracellular transport of [14C]urea in distal colon of K8+/+, +/−, and −/− mice. Distal colon from K8+/+, +/−, or −/− mice was mounted in lucite chambers. Conductance was determined from short circuit current (Isc) and potential difference (P.D.). Conductance (A) and urea fluxes, Jms urea (B), represent the average of two 15-min intervals and are expressed as mean ± SEM. n, number of tissues studied in each group. *, not significantly different from K8+/+.
Figure 3.
Figure 3.
Short circuit current and net Na and Cl fluxes in distal colon. Isc (A) and unidirectional mucosa-to-serosa and serosa-to-mucosa fluxes of 22Na (B) and 36Cl (C) were measured under voltage-clamp conditions across distal colon of K8+/+, +/−, and −/− mice bathed in normal Ringer solutions in lucite chambers. Net Na (Jnet Na) and Cl (Jnet Cl) fluxes were calculated as the difference between mucosa-to-serosa and serosa-to-mucosa fluxes between conductance-matched tissue pairs (average of two 15-min intervals expressed as mean ± SEM). n, number of tissue pairs studied in each group. *, P < 0.005; **, P < 0.002; ***, not significantly different (when compared with K8+/+).
Figure 4.
Figure 4.
Effect of external Na and Cl substitution on Isc and net Na and Cl fluxes in WT and K8-null mouse colon. (A and B) Distal colon from K8+/+ mice was mounted in lucite chambers and bathed in Na-free Ringer solution on the mucosal side and Na-containing Ringer solution on the serosal side. Unidirectional Cl fluxes were determined (−Na), and then the mucosal solution was replaced with Na-containing solution and allowed to equilibrate for 15 min, and fluxes were determined (+Na) again. (C and D) K8+/+ distal colon was bathed in Cl-free Ringer solution on the mucosal and serosal sides, and then Na fluxes were determined (−Cl) as above. Mucosal and serosal solutions were replaced with Cl-containing solution (+Cl) and fluxes were determined. Results represent an average of two time periods from five (A and B) and three (C and D) tissue pairs and are expressed as mean ± SEM. *, P < 0.005 compared with +Na; **, not statistically significant compared with +Na; §, P < 0.001 compared with +Cl; §§, P < 0.05 compared with +Cl. (E and F) Distal colon (in lucite chambers) from K8−/− mice bathed in Na-free or Cl-free Ringer solutions. Isc was measured, and the results represent the average of two 15-min intervals determined from six tissues in each group expressed as mean ± SEM. *, not statistically significant compared with control +Na or +Cl solutions, respectively.
Figure 5.
Figure 5.
Effects of transport inhibitors on Isc mouse distal colon. Distal colon (in lucite chambers) from K8+/+ (A) or K8 −/− (B) mice was bathed in normal Ringer solution and Isc was measured (control). Bumetanide (Bmet, 100 μM, serosal side), NPPB (50 μM, mucosal side), or cAMP (1 mM, serosal side) was added and allowed to equilibrate for 15 min. Isc was measured for two additional periods (+inhibitor). Results represent the average of two successive intervals (expressed as mean ± SEM). n, number of tissues studied in each group. *, not significant compared with control; **, P < 0.001 compared with control; ***, P < 0.05 compared with control. §, change in K8-null Isc after cAMP addition is not significantly different from K8 WT (using paired t test).
Figure 6.
Figure 6.
Histologic, ultrastructural, and staining analysis of K8+/+ and −/− mouse distal colon. K8+/+ and K8−/− distal colons were fixed then stained with hematoxylin and eosin (H&E; A and B), analyzed by transmission electron microscopy (TEM; C–F), or examined by immunofluorescence single or double staining to visualize H,K-ATPase (red, G–J; with nuclei stained green in I and J), K19 (red, K and L), F-actin (red, M–P; with nuclei stained blue in M–P). (A and B) Arrowheads in B highlight mitotic cells. Bar, 50 μm. L, lumen. (C–F) Arrowheads in E and F highlight keratin bundles that are present in K8+/+ (E) but absent in K8 −/− (F) mice. G, goblet cell; mv, microvilli. Bars: (C and D) 0.5 μm; (E and F) 0.05 μm. (G–J) H,K-ATPase in K8+/+ is uniformly distributed at the apical membrane of distal colon enterocytes (arrowheads in G) but is absent in the proximal colon (inset of G with asterisk highlighting apical membrane). I and J show H,K-ATPase staining at the basal regions of the crypts. Bars: (G and H) 0.05 μm; (I and J) 10 μm. The Ab also stains nonepithelial cells in the submucosa. (K and L) Arrowheads highlight the luminal apical membrane. Bar, 10 μm. (M–O) Panels O and P were obtained with identical but lower confocal laser intensity than M and N in order to visualize the uniformity (arrowheads in +/+ and −/−) versus the patchiness (asterisks in −/−) of F-actin distribution. Notably, all staining (G–P) is specific since using only second-stage antibodies on colons of +/+ or −/− mice was essentially blank (not depicted). Bar, 10 μm.
Figure 7.
Figure 7.
Alterations in K8-null ion transporter dynamics. (A) Immunoblot analysis of K8+/+, +/−, and −/− distal colon. Total homogenates of distal colon were loaded in equal amounts (based on protein assay; further verified by blotting using anti-tubulin Ab, not depicted) and then analyzed by blotting using antibodies to the indicated proteins. For each genotype, homogenates from two independent mice are shown. (B) Immunofluorescence staining of AE1/2 and ENaCγ in colon of K8+/+ and −/− mice. Distal colon AE1/2 (red, a–d), F-actin (green, a and b; not depicted in c and d in order to highlight the AE1/2 red staining), ENaCγ (red, e–h), and nuclei (blue, a–h) were stained. Panels c, d, g, and h show higher magnifications of the base of the tubular crypts of the corresponding a, b, d, and f panels. L, lumen; M, muscle layer. Asterisks in f highlight the apical expression of ENaCγ. Bars: (a and b) 50 μm; (c and d) 10 μm; (e and f) 50 μm; (g and h) 10 μm. (C) Surface cell pH and Cl/HCO3 exchange activity in K8+/+ and −/− colon. Distal colon from K8+/+ and −/− mice was loaded with the pHi-sensitive dye BCECF-AM, and individual surface epithelial cells were imaged with a low-light CCD camera. Representative pHi (vs. time) of surface cells in K8+/+ and −/− colon during transient removal of extracellular Cl (0-Cl) are shown. Bar graphs show estimated Cl/HCO3 exchange activity based on the average alkalinization observed over 5 min after Cl removal, expressed as mean ± SEM. The number of cells counted/experiments are 170/14 (K8+/+) and 120/10 (K8−/−).
Figure 8.
Figure 8.
Colonic histopathology, ion transporter distribution, and expression levels in WT and K8-null young mice. (A) Colon from 1–2-d-old and 14-d-old K8+/+ and K8−/− mice was stained with hematoxylin and eosin (H&E; a–d), or examined by immunofluorescence, double staining for ENaCγ (red, e–h) and nuclei (blue, e–h) or AE1/2 (red, i–l) and nuclei (blue, e–l). M, muscle layer; I, inflammation; L, lumen. Bars: (a–d) 50 μm; (e–h) 30 μm; (i–j) 50 μm; (k and l) 30 μm. (B) Total homogenates of the entire colon from 1–2-d-old (lanes 1–6) and 14-d-old (lanes 7–12) K8+/+ and −/− were analyzed by immunoblotting using Ab to the indicated proteins. For each genotype, homogenates from three independent mice are shown.
Figure 8.
Figure 8.
Colonic histopathology, ion transporter distribution, and expression levels in WT and K8-null young mice. (A) Colon from 1–2-d-old and 14-d-old K8+/+ and K8−/− mice was stained with hematoxylin and eosin (H&E; a–d), or examined by immunofluorescence, double staining for ENaCγ (red, e–h) and nuclei (blue, e–h) or AE1/2 (red, i–l) and nuclei (blue, e–l). M, muscle layer; I, inflammation; L, lumen. Bars: (a–d) 50 μm; (e–h) 30 μm; (i–j) 50 μm; (k and l) 30 μm. (B) Total homogenates of the entire colon from 1–2-d-old (lanes 1–6) and 14-d-old (lanes 7–12) K8+/+ and −/− were analyzed by immunoblotting using Ab to the indicated proteins. For each genotype, homogenates from three independent mice are shown.
Figure 9.
Figure 9.
Schematic summary of the K8-null mouse colonocyte phenotype. Absence of keratins in K8-null mouse intestine results in diarrhea and then colonic hyperproliferation. The diarrhea is, at least in part, due to increased Cl secretion and decreased Na absorption. These transport abnormalities are likely related to a generalized targeting defect that is reflected by patchy distribution of H,K-ATPase, ENaCγ, and actin and increased protein levels of AE1/2. PCNA levels also increase, which is consistent with the observed colonic hyperproliferation. The increased cell proliferation is likely related to altered pHi.

Similar articles

Cited by

References

    1. Ahn, Y.J., D.R. Brooker, F. Kosari, B.J. Harte, J. Li, S.A. Mackler, and T.R. Kleyman. 1999. Cloning and functional expression of the mouse epithelial sodium channel. Am. J. Physiol. 277:F121–F129. - PubMed
    1. Alper, S.L., R.B. Darman, M.N. Chernova, and N.K. Dahl. 2002. The AE gene family of Cl/HCO3- exchangers. J. Nephrol. 15(Suppl 5):S41–S53. - PubMed
    1. Alvarez de la Rosa, D., C.M. Canessa, G.K. Fyfe, and P. Zhang. 2000. Structure and regulation of amiloride-sensitive sodium channels. Annu. Rev. Physiol. 62:573-594. - PubMed
    1. Ameen, N.A., Y. Figueroa, and P.J. Salas. 2001. Anomalous apical plasma membrane phenotype in CK8-deficient mice indicates a novel role for intermediate filaments in the polarization of simple epithelia. J. Cell Sci. 114:563–575. - PubMed
    1. Baribault, H., J. Penner, R.V. Iozzo, and M. Wilson-Heiner. 1994. Colorectal hyperplasia and inflammation in keratin 8-deficient FVB/N mice. Genes Dev. 8:2964–2973. - PubMed

Publication types

MeSH terms