Comparative Study
. 2004 Mar 15;199(6):831-42.
doi: 10.1084/jem.20031058. Epub 2004 Mar 8.

CD152 (CTLA-4) determines the unequal resistance of Th1 and Th2 cells against activation-induced cell death by a mechanism requiring PI3 kinase function

Affiliations
Comparative Study

CD152 (CTLA-4) determines the unequal resistance of Th1 and Th2 cells against activation-induced cell death by a mechanism requiring PI3 kinase function

Pushpa Pandiyan et al. J Exp Med. .

Abstract

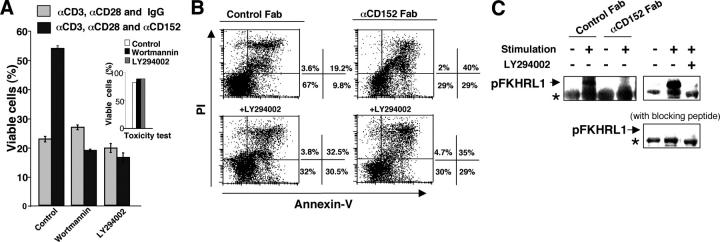
Survival of antigen-experienced T cells is essential for the generation of adaptive immune responses. Here, we show that the genetic and antibody-mediated inactivation of CD152 (cytotoxic T lymphocyte antigen 4) in T helper (Th) effector cells reduced the frequency of nonapoptotic cells in a completely Fas/Fas ligand (FasL)-dependent manner. CD152 cross-linking together with stimulation of CD3 and CD28 on activated Th2 cells prevented activation-induced cell death (AICD) as a result of reduced Fas and FasL expression. Apoptosis protection conferred by CD152 correlated with the up-regulation of Bcl-2 and was mediated by phosphatidylinositol 3 kinase, which prevented FasL expression through the inhibitory phosphorylation of Forkhead transcription factor FKHRL1. We show that signals induced by CD152 act directly on activated T lymphocytes and, due to its differential surface expression on activated Th1 and Th2 cells, induce resistance to AICD mainly in Th2 cells.


Figures

Figure 1.
Figure 1.
Detection of CD152 surface expression on Th1 and Th2 cells by enhanced fluorescence liposome staining. (A) Polarization of Th1 and Th2 cells. CD4+CD62L+ OVA-specific TCRtg/tg T cells were stimulated with 1 μg/ml OVA323–339 and T cell–depleted splenocytes. Th cell polarization was routinely determined by intracellular FACS® staining for IFN-γ and IL-4 on day 3 after the onset of an Ag-specific restimulation using PMA/ionomycin stimulation for 6 h (see Materials and Methods). Stainings with isotype-matched control antibodies are shown (left). (B) CD152 surface expression in differentiating and established Th1 and Th2 cells. The percentage of surface CD152-expressing CD4+ cells was detected by staining with an αCD152 Ab and αhamIgG-specific liposomes. Cell analysis was performed at different time points after a primary Ag-specific stimulation of naive T cells in their Th1 or Th2 milieu as indicated, followed by a secondary Ag stimulation of the established Th1 and Th2 cells. The specificity of the stainings was controlled with isotype-matched control antibodies. Indicated frequencies are values subtracted from background staining ranging from 0.5 to 2%. Surface CD152+ TCRneg cells are CD19+ B cells (analysis not depicted). (C) Representative data of CD152 staining with the enhanced liposome FACS® technique showing surface CD152+ cells 48 h after secondary stimulation. The indicated values show the frequencies of surface CD152+-expressing cells among all TCRtg CD4+ cells. Stainings with isotype-matched control antibodies are shown (left). One out of five similar experiments is shown.
Figure 2.
Figure 2.
Th1 cells are more sensitive to AICD than Th2 cells, and genetic or serological blockade of CD152 further enhances apoptosis sensitivity. (A) AICD in Th1 and Th2 cells and the effect of CD152 inhibition. CD4+CD62L+ TCRtg/tg splenocytes were stimulated with OVA323–339 and T cell–depleted APCs for 1 wk under their respective Th1 or Th2 culture conditions. Polarized Th1 and Th2 cells were restimulated in the presence of 200 μg/ml of neutralizing αCD152 Fab or hamster control Fab fragments. 3 and 6 d later, cultures were stained with annexin-V and PI to detect early apoptotic cells and late apoptotic/dead cells, respectively. The data shown represent one out of three similar experiments. Stainings were also performed on day 4 or 5 after restimulation with similar results (not depicted). Gatings in forward scatter versus side scatter dot plots are depicted (top). (B and C) Effect of CD152 blockade on apoptotic DNA fragmentation and caspase activation. Th1 and Th2 cells were stimulated and restimulated in the presence of αCD152 Fab or hamster control Fab fragments as described in A. On day 5, DNA fragmentation (B) was measured by TUNEL staining and caspase activation (C) by labeling of cells with the fluorogenic caspase substrate FITC-VAD-fmk, followed by flow cytometric analysis. The data represent the results from one out of two similar experiments. Similar results were obtained from stainings on day 6 after restimulation (not depicted).
Figure 3.
Figure 3.
CD152−/− T cells are more susceptible to AICD. Splenocytes from CD152−/− and CD152+/+ mice were stimulated with 1.5 μg/ml ConA. Annexin-V/PI stainings were performed 96 h after the onset of a primary stimulation (A) or after restimulation with 2 μg/ml αCD3, which was performed after removal of dead cells for a further 48 h (B). The frequency of viable cells is indicated together with an annexin-V staining control performed in the presence of EGTA (left). (C) Increased AICD in CD152−/− T cells compared with WT cells was also observed when apoptosis was measured by TUNEL staining after primary and secondary stimulation with ConA and αCD3, respectively.
Figure 4.
Figure 4.
CD152 blockade enhances AICD in both T cell subsets independently of IFN-γ and IL-2 induction. (A) Effect of CD152 blockade on IFN-γ production in Th1 and Th2 cells. CD4+CD62L+ TCRtg/tg splenocytes were stimulated in the presence and absence of 200 μg/ml of αCD152 or hamster control Fab fragments. Supernatants were collected on day 6 after stimulation, and the amount of IFN-γ was detected using a sensitive ELISA with a detection limit of <2 pg/ml. (B) The effect of neutralizing αIL-2 and αIL-2Rα antibodies. Polarized Th1 and Th2 cells were restimulated as described in Fig. 2 A in the presence of 200 μg/ml of neutralizing αCD152 Fab (black bars) or hamster control Fab fragments (gray bars). Some cultures (white bars) additionally received 20 μg/ml of each αIL-2 and αIL2-Rα to inhibit IL-2 signaling. 6 d after secondary stimulation, cells were stained with annexin-V and PI to determine the number of viable cells. The data represent one out of three similar experiments. Stainings were also done on days 4 and 5 with similar results (not depicted). (C) Effect of exogenous IL-2. Th1 and Th2 cells, generated and restimulated as described in Fig. 2 A, were treated with 50 U/ml of exogenous IL-2. Black and gray bars show cells incubated with solely αCD152 Fabs or ham IgG Fabs (200 μg/ml), respectively. The data represent the results from one out of two similar experiments.
Figure 5.
Figure 5.
Cross-linking of CD152 on Th2 cells inhibits AICD independently of cell cycle arrest. CD4+CD62L+ TCRtg/tg T cells were stimulated with OVA323–339 and T cell–depleted splenocytes under Th2 conditions. On day 2 after Ag-specific restimulation, CFSE-labeled CD4 cells were replated either with microspheres coated with αCD3, αCD28, and hamIgG (left) or with microspheres coated with αCD3 and αCD28 plus αCD152 (right). Cells were cultured in the presence or absence of either dB-cAMP or L-mimosine, which induced a G1 arrest. On day 3 after restimulation with the respective antibodies coupled to microspheres, annexin-V/PI stainings were performed, and the number of nonapoptotic cells was determined. An annexin-V staining control performed in the presence of EGTA is shown (left). The data represent results from two experiments with similar results.
Figure 6.
Figure 6.
Fas/FasL interaction is involved in the apoptosis-sensitizing effect of CD152 inhibition. (A) FasL-neutralizing antibodies protect against cell death induced by αCD152 Fab fragments. Polarized Th1 and Th2 cells were restimulated as described in Fig. 2 A with or without blocking of CD152. Control ham IgG Fabs and αCD152 Fabs were used at 200 μg/ml in primary and secondary stimulations. FasL signaling was blocked during secondary Ag-specific stimulation by using the neutralizing αmurine FasL moAb 3C82 (20 μg/ml). After 6 d of secondary stimulation, cell viability was assessed by annexin-V and PI staining. Data from one out of three similar experiments are shown. Measurements were also performed on day 5 with similar results (not depicted). (B) Blockade of CD152 up-regulates Fas and FasL expression. Fas and FasL molecules were stained on the surface of Th1 and Th2 cells at different time points after secondary stimulation with or without blocking of CD152. All stainings were controlled using isotype-matched control antibodies (dotted lines). The histograms from one out of three similar experiments are shown. Geometric means of fluorescence intensity are indicated in parentheses. (C) FasL is up-regulated in activated CD152−/− T cells. Stainings were performed on CD4+ cells from CD152−/− or CD152+/+ mice at the indicated time points after the onset of the secondary stimulation. Dotted gray lines show stainings with isotype-matched control antibodies. Geometric means of FasL expression in CD152−/− and WT T cells are indicated in parentheses.
Figure 7.
Figure 7.
CD152-mediated inhibition of apoptosis requires a functional PI3 K pathway. (A) Inhibition of PI3 K prevents the protecting effect triggered by CD152. Th2 cells were generated as described in Fig. 2 A, and on day 2 after secondary stimulation, they were replated with αCD3/αCD28/IgG- or αCD3/αCD28/αCD152-coated microspheres in the presence or absence of the PI3 K inhibitors wortmannin or LY294002. 4 d after replating cell viability was determined by annexin-V/PI staining. The inset in A shows a toxicity control in which unstimulated cells were treated with the PI3 K inhibitors for 2 d. (B) Polarized Th2 cells were restimulated as described in Fig. 2 A with or without blocking of CD152. To inhibit PI3 K, cultures were incubated with LY294002 during secondary stimulation. After 6 d of secondary stimulation, cell viability was assessed by annexin-V/PI staining. (C) Inhibition of CD152 signaling impairs Ag/APC-induced phosphorylation of Forkhead transcription factor FKHRL1 (left). Th2 cells were generated and restimulated as aforementioned. After 24 h, FKHRL1 phosphorylation was determined in whole cell lysates by immunoblotting using a phosphorylation-specific FKHRL1 Ab. The FKHRL1-specific protein band is indicated by an arrow, and the asterisks denote a nonspecific protein band that served as a control for equal protein loading. Additional controls, including incubation of cells in the presence of LY294002 or competition of the Ab with the immunizing FKHRL1 peptide confirmed the specificity of the immunoblot analysis (right). The data shown represent one out of two to four experiments.
Figure 8.
Figure 8.
Inhibition of CD152 signaling in Th2 cells down-regulates Bcl-2 expression. (A) Th2 cells were generated and restimulated as described in Fig. 2 A. At the indicated days after the onset of Ag-specific secondary stimulation, Th2 cells were fixed and stained for Bcl-2 (solid lines). The geometric means of Bcl-2 expression are indicated in parentheses. The dotted lines show the staining obtained with an isotype-matched control Ab. (B) CD152 ligation up-regulates Bcl-2 expression by a PI3 K–dependent pathway. Th2 cells were restimulated and treated in the presence or absence of LY294002 as described in Fig. 7. On day 6 after replating, cells were fixed and stained with Bcl-2–specific (solid lines) or isotype-matched control antibodies (dotted lines). The percentage of cells with up-regulated Bcl-2 expression is indicated. The data shown represent one out of two to four experiments.

References

    1. Watanabe-Fukunaga, R., C.I. Brannan, N.G. Copeland, N.A. Jenkins, and S. Nagata. 1992. Lymphoproliferation disorder in mice explained by defects in Fas antigen that mediates apoptosis. Nature. 356:314–317. - PubMed
    1. Lynch, D.H., M.L. Watson, M.R. Alderson, P.R. Baum, R.E. Miller, T. Tough, M. Gibson, T. Davissmith, C.A. Smith, K. Hunter, et al. 1994. The mouse Fas-ligand gene is mutated in gld mice and is part of a TNF family gene cluster. Immunity. 1:131–136. - PubMed
    1. Lenardo, M., K.M. Chan, F. Hornung, H. McFarland, R. Siegel, J. Wang, and L. Zheng. 1999. Mature T lymphocyte apoptosis-immune regulation in a dynamic and unpredictable antigenic environment. Annu. Rev. Immunol. 17:221–253. - PubMed
    1. Pinkoski, M.J., and D.R. Green. 2002. Lymphocyte apoptosis: refining the paths to perdition. Curr. Opin. Hematol. 9:43–49. - PubMed
    1. Datta, S.R., A. Brunet, and M.E. Greenberg. 1999. Cellular survival: a play in three Akts. Genes Dev. 13:2905–2927. - PubMed

Publication types

MeSH terms