Review
. 2004 Mar 16;101(11):3747-52.
doi: 10.1073/pnas.0400087101. Epub 2004 Mar 8.

The architecture of complex weighted networks

Affiliations
Review

The architecture of complex weighted networks

A Barrat et al. Proc Natl Acad Sci U S A. .

Abstract

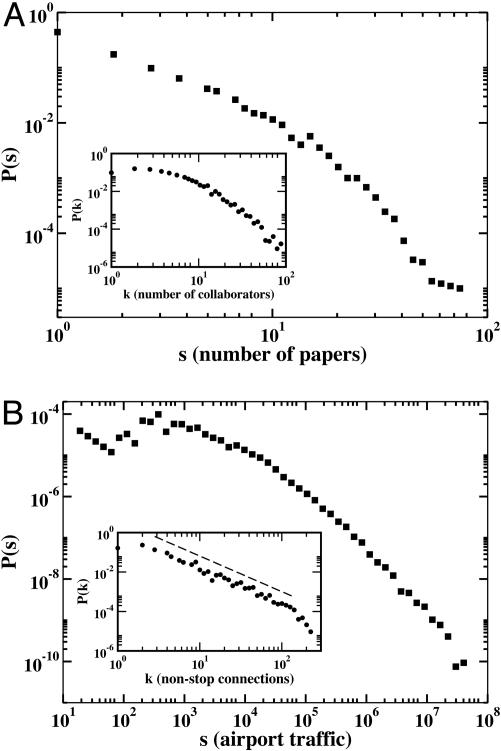
Networked structures arise in a wide array of different contexts such as technological and transportation infrastructures, social phenomena, and biological systems. These highly interconnected systems have recently been the focus of a great deal of attention that has uncovered and characterized their topological complexity. Along with a complex topological structure, real networks display a large heterogeneity in the capacity and intensity of the connections. These features, however, have mainly not been considered in past studies where links are usually represented as binary states, i.e., either present or absent. Here, we study the scientific collaboration network and the world-wide air-transportation network, which are representative examples of social and large infrastructure systems, respectively. In both cases it is possible to assign to each edge of the graph a weight proportional to the intensity or capacity of the connections among the various elements of the network. We define appropriate metrics combining weighted and topological observables that enable us to characterize the complex statistical properties and heterogeneity of the actual strength of edges and vertices. This information allows us to investigate the correlations among weighted quantities and the underlying topological structure of the network. These results provide a better description of the hierarchies and organizational principles at the basis of the architecture of weighted networks.


Figures

Fig. 1.
Fig. 1.
Pictorial representation of the weighted graph obtained from the airport network data. Major U.S. airports are connected by edges denoting the presence of a nonstop flight in both directions whose weights represent the number of available seats (million/year).
Fig. 2.
Fig. 2.
(A) Degree (Inset) and strength distribution in the SCN. The degree k corresponds to the number of coauthors of each scientist, and the strength s represents the scientist's total number of publications. The distributions are heavy-tailed even if it is not possible to distinguish a definite functional form. (B) The same distributions for the WAN. The degree k (Inset) is the number of nonstop connections to other airports, and the strength s is the total number of passengers handled by any given airport. In this case, the degree distribution can be approximated by the power-law behavior P(k) ∼ k with γ = 1.8 ± 0.2. The strength distribution has a heavy tail extending over more than four orders of magnitude.
Fig. 3.
Fig. 3.
Average strength s(k) as function of the degree k of nodes. (A) In the SCN the real data are very similar to those obtained in a randomized weighted network. Only at very large k values is it possible to observe a slight departure from the expected linear behavior. (B) In the WAN real data follow a power-law behavior with exponent β = 1.5 ± 0.1. This value denotes anomalous correlations between the traffic handled by an airport and the number of its connections.
Fig. 4.
Fig. 4.
Average weight as a function of the end-point degree. The solid line corresponds to a power-law behavior formula image, with exponent θ = 0.5 ± 0.1. In the case of the SCN it is possible to observe an almost flat behavior for roughly two orders of magnitude.
Fig. 5.
Fig. 5.
Examples of local configurations whose topological and weighted quantities are different. In both cases the central vertex (filled) has a very strong link with only one of its neighbors. The weighted clustering and average nearest neighbors degree capture more precisely the effective level of cohesiveness and affinity due to the actual interaction strength.
Fig. 6.
Fig. 6.
Topological and weighted quantities for the SCN. (A) The weighted clustering separates from the topological one around k ≥ 10. This value marks a difference for authors with larger number of collaborators. (B) The assortative behavior is enhanced in the weighted definition of the average nearest-neighbors degree.
Fig. 7.
Fig. 7.
Topological and weighted quantities for the WAN. (A) The weighted clustering coefficient is larger than the topological one in the whole degree spectrum. (B) knn(k) reaches a plateau for k > 10 denoting the absence of marked topological correlations. In contrast, formula image exhibits a more definite assortative behavior.

References

    1. Albert, R. & Barabási, A.-L. (2002) Rev. Mod. Phys. 74, 47-97.
    1. Dorogovtsev, S. N. & Mendes, J. F. F. (2003) Evolution of Networks: From Biological Nets to the Internet and WWW (Oxford Univ. Press, Oxford).
    1. Amaral, L. A. N., Scala, A., Barthélemy, M. & Stanley, H. E. (2000) Proc. Natl. Acad. Sci. USA 97, 11149-11152. - PMC - PubMed
    1. Watts, D. J. & Strogatz, S. H. (1998) Nature 393, 440-442. - PubMed
    1. Barabási, A.-L & Albert, R. (1999) Science 286, 509-512. - PubMed

Publication types

LinkOut - more resources