. 2004 Mar 16;101(11):3809-14.
doi: 10.1073/pnas.0306433101. Epub 2004 Mar 8.

Microsecond folding dynamics of the F13W G29A mutant of the B domain of staphylococcal protein A by laser-induced temperature jump

Affiliations

Microsecond folding dynamics of the F13W G29A mutant of the B domain of staphylococcal protein A by laser-induced temperature jump

George Dimitriadis et al. Proc Natl Acad Sci U S A. .

Abstract

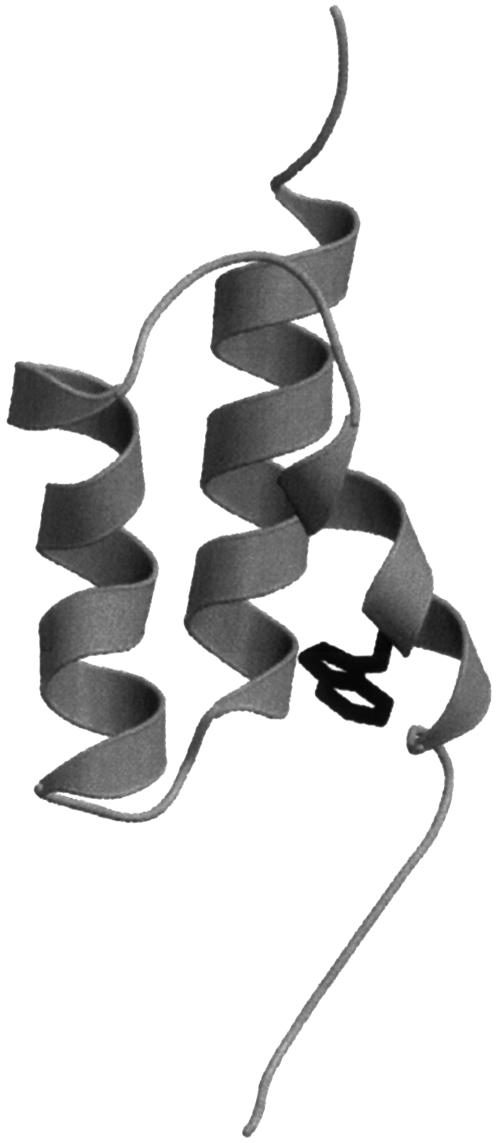
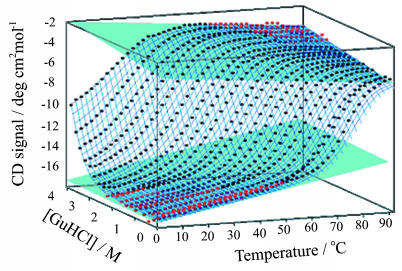
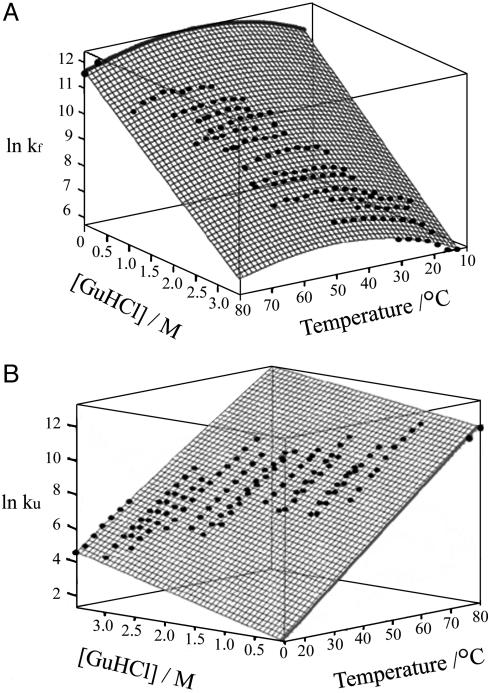
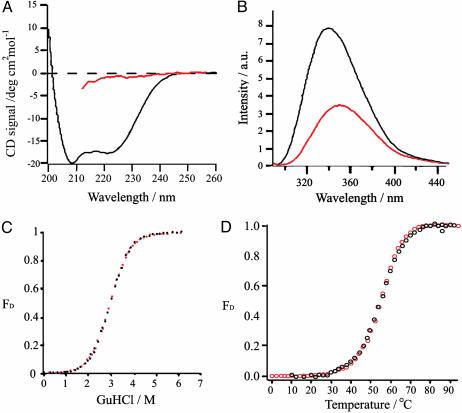
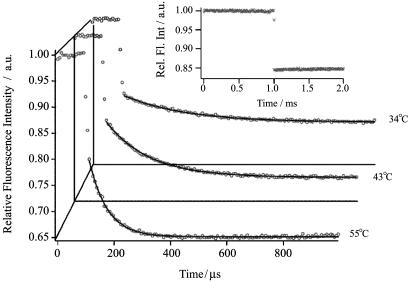
The small size (58 residues) and simple structure of the B domain of staphylococcal protein A (BdpA) have led to this domain being a paradigm for theoretical studies of folding. Experimental studies of the folding of BdpA have been limited by the rapidity of its folding kinetics. We report the folding kinetics of a fluorescent mutant of BdpA (G29A F13W), named F13W*, using nanosecond laser-induced temperature jump experiments. Automation of the apparatus has permitted large data sets to be acquired that provide excellent signal-to-noise ratio over a wide range of experimental conditions. By measuring the temperature and denaturant dependence of equilibrium and kinetic data for F13W*, we show that thermodynamic modeling of multidimensional equilibrium and kinetic surfaces is a robust method that allows reliable extrapolation of rate constants to regions of the folding landscape not directly accessible experimentally. The results reveal that F13W* is the fastest-folding protein of its size studied to date, with a maximum folding rate constant at 0 M guanidinium chloride and 45 degrees C of 249,000 s(-1). Assuming the single-exponential kinetics represent barrier-limited folding, these data limit the value for the preexponential factor for folding of this protein to at least approximately 2 x 10(6) s(-1).


Figures

Fig. 1.
Fig. 1.
Structure of BdpA showing the position of the tryptophan residue substituted for Phe at position 13 to provide a fluorescence probe. Gly-29 was also mutated to Ala in this study. The figure is based on the WT crystal structure with PDB coordinates 1BDD, and the mutations were incorporated by using swiss model (www.expasy.org/swissmod/SWISS-MODEL.html).
Fig. 3.
Fig. 3.
Equilibrium unfolding of F13W* as a function of temperature and GuHCl concentration. Native and denatured base planes shown in blue are fitted to the data points shown in red to permit a global surface fit to the data (see Materials and Methods) yielding the thermodynamic parameters listed in Table 2.
Fig. 5.
Fig. 5.
Kinetic folding and unfolding surfaces of F13W*. Shown are kf (A) and ku (B) as a function of GuHCl concentration and temperature. The surfaces are fitted to the thermodynamic model described in Materials and Methods. The thick black lines are the extrapolated fits to 0 M GuHCl. The data points at 0 M GuHCl and final temperatures of 76°C and 80°C were determined in a separate pair of T jump experiments and were not used in the fitting of the kinetic surfaces.
Fig. 2.
Fig. 2.
Equilibrium unfolding of F13W* is two-state. (A) CD spectra of F13W* in 0 M GuHCl (black) and 6 M GuHCl (red). (B) Fluorescence emission spectra (λex = 290 nm) in 0 M (black) and 6 M (red) GuHCl. (C) Equilibrium denaturation of F13W* vs. GuHCl measured by using CD at 222 nm (red) and the fluorescence emission intensity at 350 nm (black). (D) Equilibrium denaturation of F13W* vs. temperature in 2.2 M GuHCl by using CD at 222 nm (red) and the fluorescence emission intensity at 350 nm (black). The experiments in A-C were carried out in buffer A at 37°C. The experiment in D was carried out in buffer A containing 2.2 M GuHCl.
Fig. 4.
Fig. 4.
Typical relaxation kinetics of F13W* after T jumps of a magnitude of 10°C to 55°C, 43°C, and 34°C in 2.6 M GuHCl. Each trace represents the average of 50 experiments at the same final temperature, and each point represents the average integrated intensity of 50 consecutive fluorescent pulses that are separated by 130 ns, giving a final temporal resolution in this case of 6.5 μs. The data are normalized to the intensity of the protein fluorescence before the T jump. The relaxation kinetics are fitted to a single-exponential function (solid black lines). (Inset) The fluorescence intensity change of a sample of N-acetyl tryptophan-amide after a 10°C T jump to 50°C.

References

    1. Jackson, S. E. & Fersht, A. R. (1991) Biochemistry 30, 10428-10435. - PubMed
    1. Huang, G. S. & Oas, T. G. (1995) Proc. Natl. Acad. Sci. USA 92, 6878-6882. - PMC - PubMed
    1. Kragelund, B. B., Robinson, C. V., Knudsen, J., Dobson, C. M. & Poulsen, F. M. (1995) Biochemistry 34, 7217-7224. - PubMed
    1. Villegas, V., Azuaga, A., Catasus, L., Reverter, D., Mateo, P. L., Aviles, F. X. & Serrano, L. (1995) Biochemistry 34, 15105-15110. - PubMed
    1. Schindler, T., Herrler, M., Marahiel, M. A. & Schmid, F. X. (1995) Nat. Struct. Biol. 2, 663-673. - PubMed

Publication types

Substances