

The scaling of frontal cortex in primates and carnivores
- PMID: 15007170
- PMCID: PMC374352
- DOI: 10.1073/pnas.0305760101
The scaling of frontal cortex in primates and carnivores
Abstract
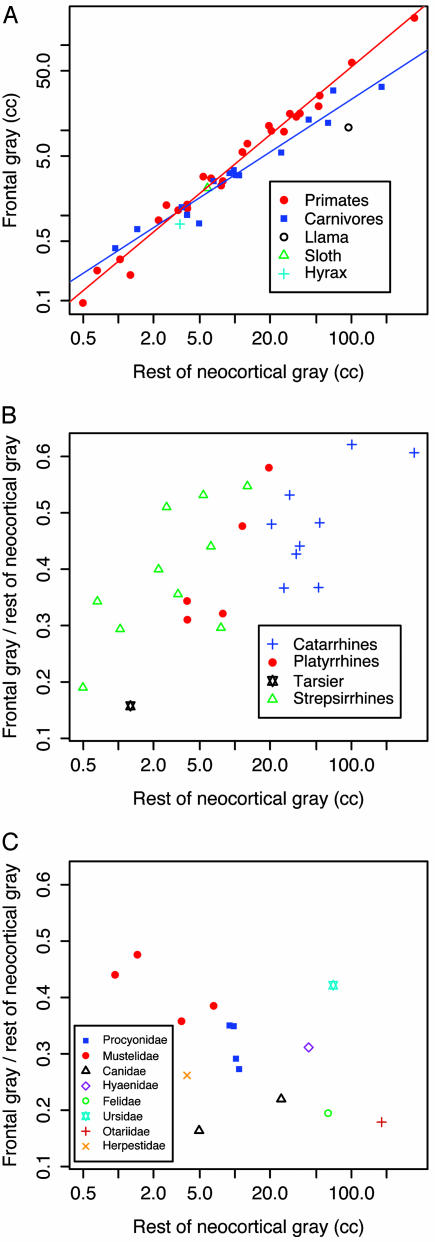
Size has a profound effect on the structure of the brain. Many brain structures scale allometrically, that is, their relative size changes systematically as a function of brain size. Here we use independent contrasts analysis to examine the scaling of frontal cortex in 43 species of mammals including 25 primates and 15 carnivores. We find evidence for significant differences in scaling between primates and carnivores. Primate frontal cortex hyperscales relative to the rest of neocortex and the rest of the brain. The slope of frontal cortex contrasts on rest of cortex contrasts is 1.18 (95% confidence interval, 1.06-1.30) for primates, which is significantly greater than isometric. It is also significantly greater than the carnivore value of 0.94 (95% confidence interval, 0.82-1.07). This finding supports the idea that there are substantial differences in frontal cortex structure and development between the two groups.
Figures
References
-
- Baillarger, J. (1845) Gazette des Hopitaux 18, 179.
-
- Dubois, E. (1913) Verh. Kon. Akad. Wetenschappen Amsterdam 16, 647.
-
- Frahm, H. D., Stephan, H. & Stephan, M. (1982) J. Hirnforsch. 23, 375-389. - PubMed
-
- Haug, H. (1987) Am. J. Anat. 180, 126-142. - PubMed
-
- Finlay, B. L. & Darlington, R. B. (1995) Science 268, 1578-1584. - PubMed
Publication types
MeSH terms
Grants and funding
LinkOut - more resources
Full Text Sources
