. 2004 Jul;92(1):83-95.
doi: 10.1152/jn.00083.2003. Epub 2004 Mar 10.

Motor outputs from the primate reticular formation to shoulder muscles as revealed by stimulus-triggered averaging

Affiliations

Motor outputs from the primate reticular formation to shoulder muscles as revealed by stimulus-triggered averaging

Adam G Davidson et al. J Neurophysiol. 2004 Jul.

Abstract

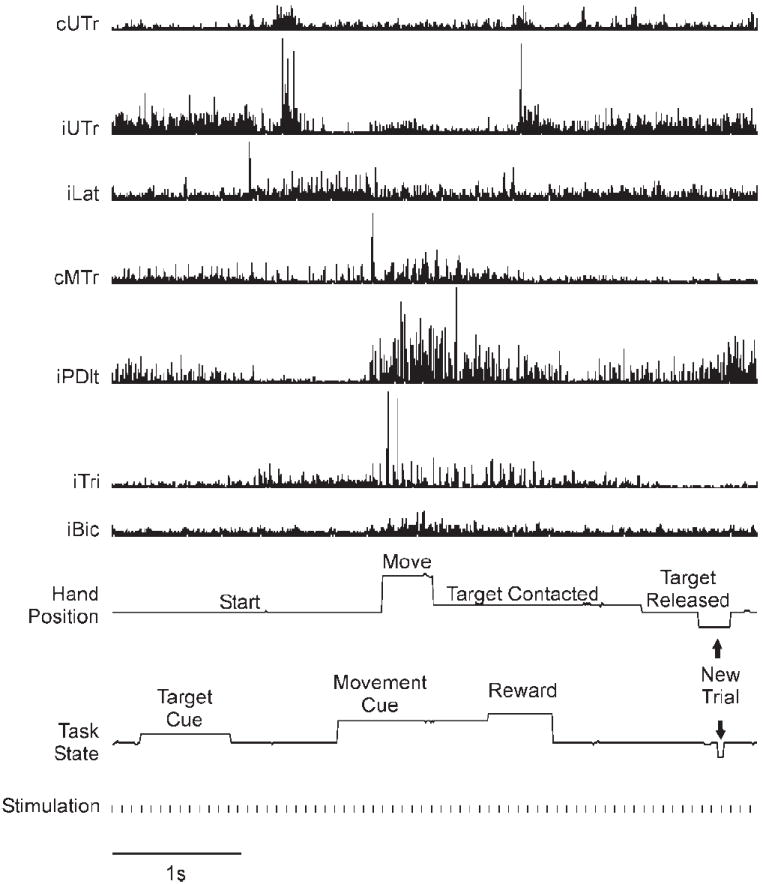
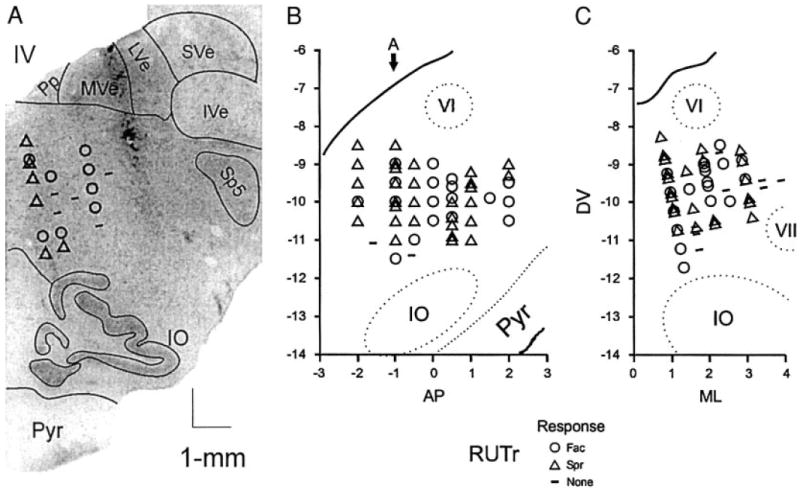
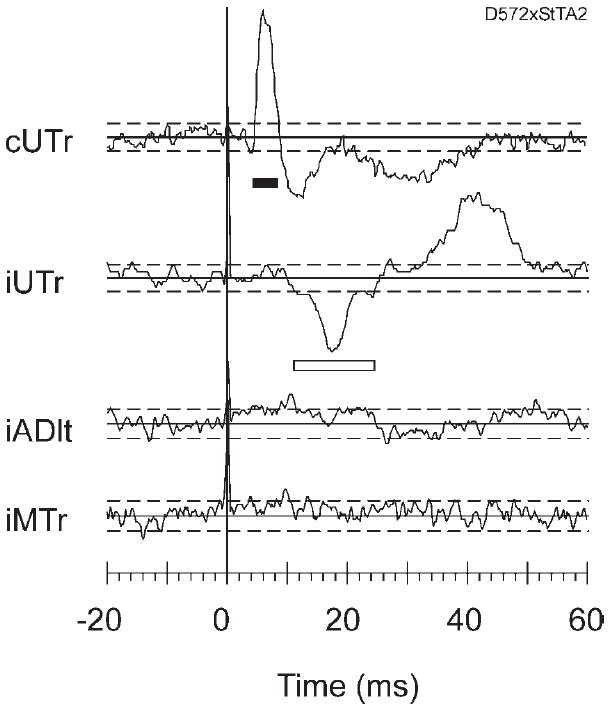
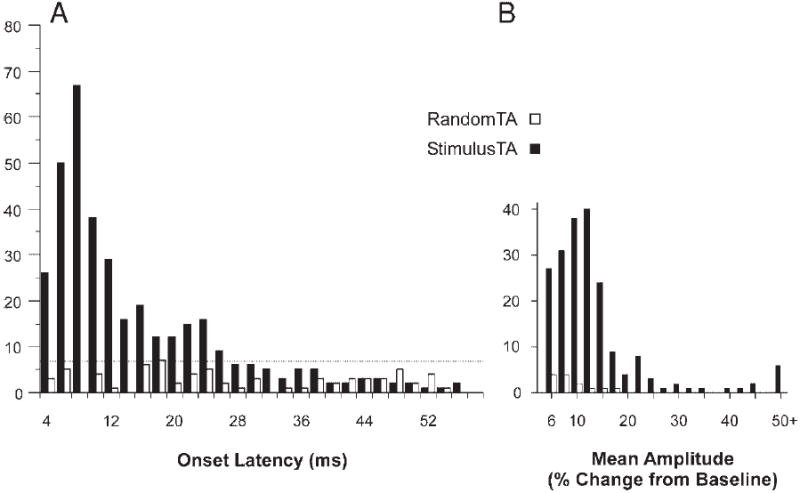
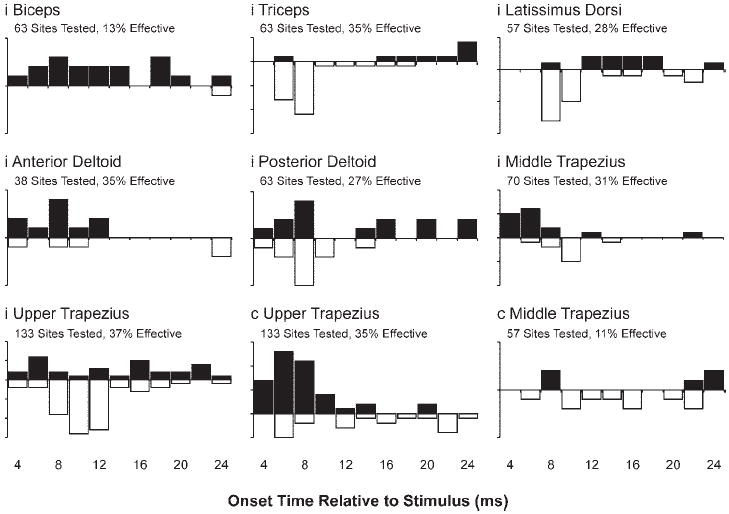
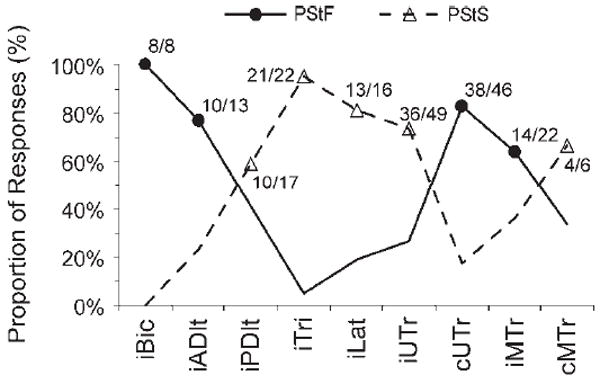
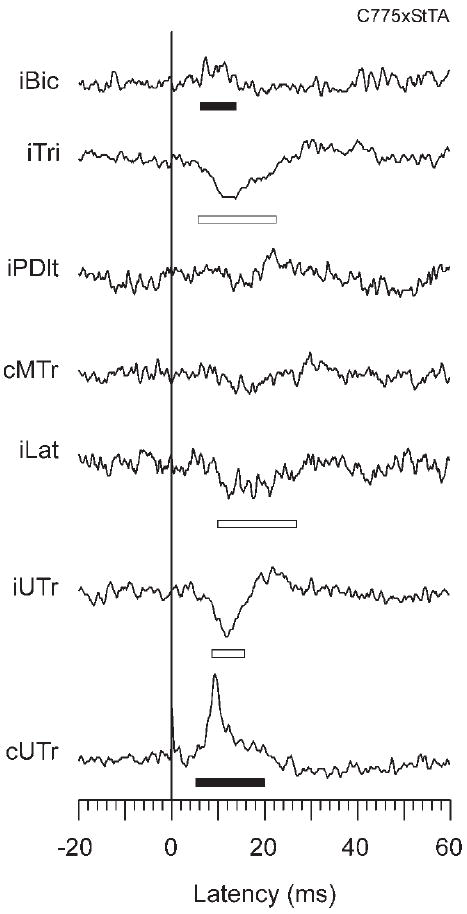
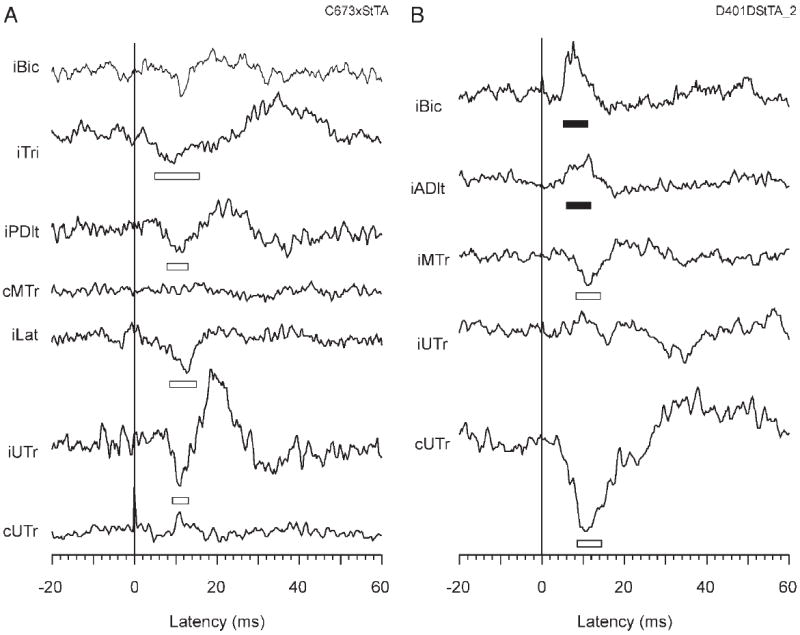
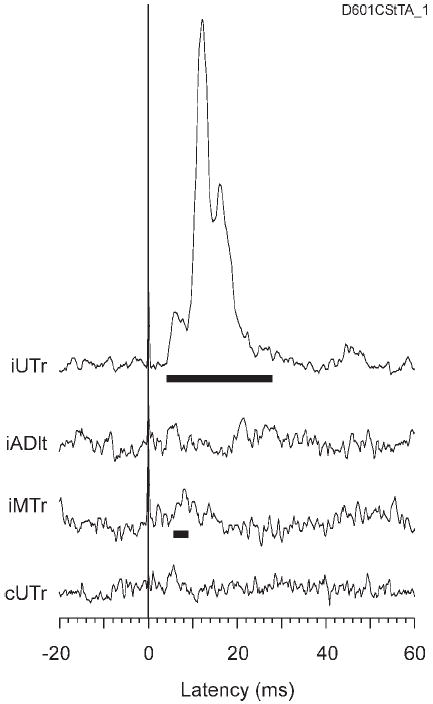
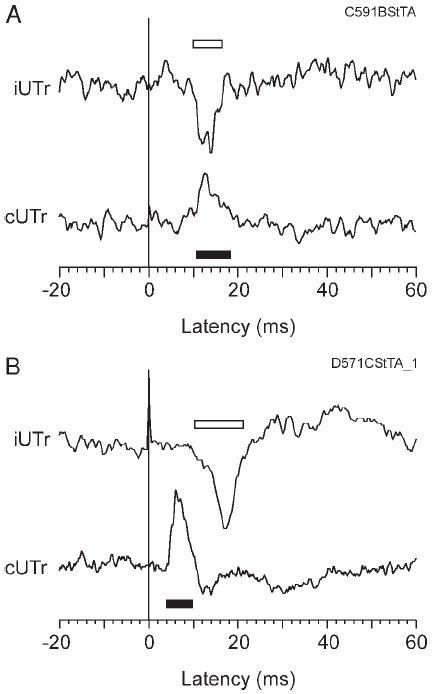
The motor output of the medial pontomedullary reticular formation (mPMRF) was investigated using stimulus-triggered averaging (StimulusTA) of EMG responses from proximal arm and shoulder muscles in awake, behaving monkeys (M. fascicularis). Muscles studied on the side ipsilateral (i) to stimulation were biceps (iBic), triceps (iTri), anterior deltoid (iADlt), posterior deltoid (iPDlt), and latissimus dorsi (iLat). The upper and middle trapezius were studied on the ipsilateral and contralateral (c) side (iUTr, cUTr, iMTr, cMTr). Of 133 sites tested, 97 (73%) produced a poststimulus effect (PStE) in one or more muscles; on average, 38% of the sampled muscles responded per effective site. For responses that were observed in the arm and shoulder, poststimulus facilitation (PStF) was prevalent for the flexors, iBic (8 responses, 100% PStF) and iADlt (13 responses, 77% PStF), and poststimulus suppression (PStS) was prevalent for the extensors, iTri (22 responses, 96% PStS) and iLat (16 responses, 81% PStS). For trapezius muscles, PStS of upper trapezius (iUTr, 49 responses, 73% PStS) and PStF of middle trapezius (iMTr, 22 responses, 64% PStF) were prevalent ipsilaterally, and PStS of middle trapezius (cMTr, 6 responses, 67% PStS) and PStF of upper trapezius (cUTr, 46 responses, 83% PStS) were prevalent contralaterally. Onset latencies were significantly earlier for PStF (7.0 +/- 2.2 ms) than for PStS (8.6 +/- 2.0 ms). At several sites, extremely strong PStF was evoked in iUTr, even though PStS was most common for this muscle. The anatomical antagonists iBic/iTri were affected reciprocally when both responded. The bilateral muscle pair iUTr/cUTr demonstrated various combinations of effects, but cUTr PStF with iUTr PStS was prevalent. Overall, the results are consistent with data from the cat and show that outputs from the mPMRF can facilitate or suppress activity in muscles involved in reaching; responses that would contribute to flexion of the ipsilateral arm were prevalent.


Figures

FIG. 1
FIG. 1
Representative sample of EMG during task performance. EMG recorded from Monkey C is represented for a 5-s segment of the task. Although this record did not include stimulation, a trace-labeled stimulation is provided to illustrate the frequency of stimulation in the context of the task. iUTr, ipsilateral upper trapezius; cUTr, contralateral upper trapezius; iLat, ipsilateral latissimus dorsi; iMTr, ipsilateral middle trapezius; iPDlt, ipsilateral posterior deltoid; iTri, ipsilateral triceps; iBic, ipsilateral biceps.
FIG. 2
FIG. 2
Anatomical location of effective stimulation sites for iUTr (subject D). Key indicates the type of response represented by each symbol. In A, stimulation sites for one plane (AP, −1) are superimposed on a corresponding brain stem section. In B and C, all stimulation sites are illustrated for the anterior–posterior (AP, B) and medial–lateral (ML, C) planes. Arrow in B (labeled A) indicates the plane illustrated in A. Approximate location of the facial nucleus (VII), abducens nucleus (VI), inferior olive (IO), and the pyramidal tract (Pyr) are indicated in B and C. AP, ML, and dorsal–ventral (DV) scales are in Horsley–Clarke stereotaxic coordinates. IV, fourth ventricle; Pp, nucleus prepositus; MVe, LVe, SVe, and IVe, medial, lateral, superior, and inferior vestibular nuclei, respectively; Sp5, spinal trigeminal nucleus.
FIG. 3
FIG. 3
Detection of poststimulus events. For each trace, the mean EMG level for the baseline period is illustrated by a solid horizontal line, and dotted horizontal lines above and below the mean indicate ±2 SD. Filled bars represent periods of PStF; open bars represent PStS. Stimuli were applied at 20 μA. iUTr, ipsilateral middle trapezius; iADlt, ipsilateral anterior deltoid. SDPk for events: iUTr (17.6), cUTr (27.4).
FIG. 4
FIG. 4
A: number of responses by onset latency for all acceptable events detected in response to actual stimulation (StimulusTA, filled bars) and to randomly timed fake stimuli from the same data files (RandomTA, open bars). Dashed horizontal line is drawn at a level 2 SDs above the mean number of RandomTA events per 2-ms bin. B: distribution of response amplitudes for StimulusTA and RandomTA events with onsets between 3.5 and 12.5 ms. Amplitude is expressed in terms of the variable mean percentage change (MPC) (see METHODS); the mean amplitude expressed as a percentage change from the baseline.
FIG. 5
FIG. 5
Histograms of PStEs by onset latency for each muscle; bin size is 2 ms, and there are 5 responses per vertical tick mark. Only events with onsets before 25 ms are represented. PStF is represented by upward, filled bars; PStS is represented by downward, empty bars. For each muscle, the number of sites stimulated for which a recording of that muscle’s EMG was available is noted as the number of sites tested. Percentage of those sites for which a response occurred with an onset between 3.5 and 12.5 ms is indicated as the percent effective.
FIG. 6
FIG. 6
Proportions of PStF (solid line) and PStS (dashed line) events by muscle. Only events with onset latencies from 3.5 to 12.5 ms are represented. For the type of response that was most prevalent for each muscle, the data point is marked with a symbol (● for PStF, Δ for PStS), and the number of times that response was observed is indicated as a fraction of the total number of responses observed for that muscle.
FIG. 7
FIG. 7
Typical stimulus-triggered average. Filled bars represent PStF; open bars represent PStS. Stimuli were applied at 25 μA. SDPk of events: iBic (4.8), iTri (10.6), iLat (5.6), iUTr (7.8), cUTr (25.4).
FIG. 8
FIG. 8
Additional examples of stimulus-triggered averages. Filled bars represent facilitation and open bars suppression. A: stimuli were applied at 30 μA. SDPk of events: iTri (5.8), iPDlt (4.6), iLat (8.2), iUTr (5.8). B: stimuli were applied at 30 μA. SDPk of events: iBic (11.5), iADlt (6.5), iMTr (8.6), cUTr (11.5).
FIG. 9
FIG. 9
Large-amplitude, short-latency response in ipsilateral upper trapezius. Stimuli were applied at 30 μA. SDPk of events: iUTr (85.0), iMTr (4.4).
FIG. 10
FIG. 10
Bilateral responses in upper trapezius. A: reciprocal response of iUTr PStS and cUTr PStF. Stimuli were applied at 40 μA. SDPk of events: iUTr (8.4), cUTr (8.4) B: serial response of iUTr PStS and cUTr PStF. Stimuli were applied at 30 μA. SDPk of events: iUTr (15.7), cUTr (18.9).

Similar articles

Cited by

References

    1. Alstermark B, Kummel H, Tantisira B. Monosynaptic raphespinal and reticulospinal projection to forelimb motoneurones in cats. Neurosci Lett. 1987;74:286–290. - PubMed
    1. Belhaj-Saif A, Karrer JH, Cheney PD. Distribution and characteristics of poststimulus effects in proximal and distal forelimb muscles from red nucleus in the monkey. J Neurophysiol. 1998;79:1777–1789. - PubMed
    1. Betts B, Smith JL, Edgerton VR, Collatos TC. Telemetered EMG of fast and slow muscles in cats. Brain Res. 1976;117:529–533. - PubMed
    1. Bolton PS, Goto T, Schor RH, Wilson VJ, Yamagata Y, Yates BJ. Response of pontomedullary reticulospinal neurons to vestibular stimuli in vertical planes. Role in vertical vestibulospinal reflexes of the decerebrate cat. J Neurophysiol. 1992;67:639–647. - PubMed
    1. Bowden D, Dubach M, MacArthur E, Song E. BrainInfo (2000) Neuroscience Division, Regional Primate Research Center, University of Washington; 2003. Electronic Citation.

Publication types

LinkOut - more resources