Efficient isolation and gene expression profiling of small numbers of neural crest stem cells and developing Schwann cells
- PMID: 15014110
- PMCID: PMC6729482
- DOI: 10.1523/JNEUROSCI.4083-03.2004
Efficient isolation and gene expression profiling of small numbers of neural crest stem cells and developing Schwann cells
Abstract
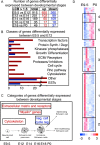
Schwann cells develop from multipotent neural crest stem cells and are important for neuronal survival, maintenance of axonal integrity, and myelination. We used transgenic mice expressing green fluorescent protein in a tissue-specific manner to isolate viable, pure populations of neural crest stem cells and developing Schwann cells, which are not readily accessible by microdissection. Starting with the minute amounts of RNA obtained, a two-round amplification procedure was used to achieve reproducible DNA array hybridizations. We validated our screening procedure by comparisons with the literature and by in situ hybridization. Stage-to-stage comparisons and hierarchical clustering for neural crest and five stages of Schwann cell development suggest a wealth of candidates for genes involved in stem cell regulation and in early Schwann cell development. The combination of methods applied in this study should be generally useful for isolating and profiling other stem cell and difficult to isolate cell populations.
Figures


Similar articles
-
Analysis of connexin expression during mouse Schwann cell development identifies connexin29 as a novel marker for the transition of neural crest to precursor cells.Glia. 2007 Jan 1;55(1):93-103. doi: 10.1002/glia.20427. Glia. 2007. PMID: 17024657
-
[Phenotypic plasticity of neural crest-derived melanocytes and Schwann cells].Biol Aujourdhui. 2011;205(1):53-61. doi: 10.1051/jbio/2011008. Epub 2011 Apr 19. Biol Aujourdhui. 2011. PMID: 21501576 Review. French.
-
The trunk neural crest and its early glial derivatives: a study of survival responses, developmental schedules and autocrine mechanisms.Mol Cell Neurosci. 2004 Jan;25(1):30-41. doi: 10.1016/j.mcn.2003.09.006. Mol Cell Neurosci. 2004. PMID: 14962738
-
Neural crest and mesoderm lineage-dependent gene expression in orofacial development.Differentiation. 2007 Jun;75(5):463-77. doi: 10.1111/j.1432-0436.2006.00145.x. Epub 2007 Feb 5. Differentiation. 2007. PMID: 17286603
-
Development of the Schwann cell lineage: from the neural crest to the myelinated nerve.Glia. 2008 Nov 1;56(14):1481-1490. doi: 10.1002/glia.20723. Glia. 2008. PMID: 18803317 Review.
Cited by
-
Integrative analysis of the mouse embryonic transcriptome.Bioinformation. 2007 Apr 10;1(10):406-13. doi: 10.6026/97320630001406. Bioinformation. 2007. PMID: 17597930 Free PMC article.
-
Protease Activated Receptor 1 and Its Ligands as Main Regulators of the Regeneration of Peripheral Nerves.Biomolecules. 2021 Nov 10;11(11):1668. doi: 10.3390/biom11111668. Biomolecules. 2021. PMID: 34827666 Free PMC article. Review.
-
Diversity of developing peripheral glia revealed by single-cell RNA sequencing.Dev Cell. 2021 Sep 13;56(17):2516-2535.e8. doi: 10.1016/j.devcel.2021.08.005. Epub 2021 Aug 31. Dev Cell. 2021. PMID: 34469751 Free PMC article.
-
A rapid and versatile method for the isolation, purification and cryogenic storage of Schwann cells from adult rodent nerves.Sci Rep. 2016 Aug 23;6:31781. doi: 10.1038/srep31781. Sci Rep. 2016. PMID: 27549422 Free PMC article.
-
Two factor-based reprogramming of rodent and human fibroblasts into Schwann cells.Nat Commun. 2017 Feb 7;8:14088. doi: 10.1038/ncomms14088. Nat Commun. 2017. PMID: 28169300 Free PMC article.
References
-
- Affymetrix Inc. (2000) Expression analysis: technical manual.
-
- Affymetrix Inc. (2002) GeneChip eukaryotic small sample target labeling assay version II, Technical Note 701265, Rev 3.
-
- Anderson DJ (1997) Cellular and molecular biology of neural crest cell lineage determination. Trends Genet 13: 276-280. - PubMed
Publication types
MeSH terms
Substances
LinkOut - more resources
Full Text Sources
Other Literature Sources
Medical
Molecular Biology Databases
