. 2004 Mar 10;24(10):2401-11.
doi: 10.1523/JNEUROSCI.5561-03.2004.

Alterations in glucose metabolism induce hypothermia leading to tau hyperphosphorylation through differential inhibition of kinase and phosphatase activities: implications for Alzheimer's disease

Affiliations

Alterations in glucose metabolism induce hypothermia leading to tau hyperphosphorylation through differential inhibition of kinase and phosphatase activities: implications for Alzheimer's disease

Emmanuel Planel et al. J Neurosci. .

Abstract

Alzheimer's disease (AD) brains contain neurofibrillary tangles (NFTs) composed of abnormally hyperphosphorylated tau protein. Regional reductions in cerebral glucose metabolism correlating to NFT densities have been reported in AD brains. Assuming that reduced glucose metabolism might cause abnormal tau hyperphosphorylation, we induced in vivo alterations of glucose metabolism in mice by starvation or intraperitoneal injections of either insulin or deoxyglucose. We found that the treatments led to abnormal tau hyperphosphorylation with patterns resembling those in early AD brains and also resulted in hypothermia. Surprisingly, tau hyperphosphorylation could be traced down to a differential effect of low temperatures on kinase and phosphatase activities. These data indicate that abnormal tau hyperphosphorylation is associated with altered glucose metabolism through hypothermia. Our results imply that serine-threonine protein phosphatase 2A plays a major role in regulating tau phosphorylation in the adult brain and provide in vivo evidence for its crucial role in abnormal tau hyperphosphorylation in AD.


Figures

Figure 2.
Figure 2.
Tau phosphorylation in the cerebellum during alterations in glucose metabolism. Western blot analysis of mouse hippocampal-neocortical extracts (Hc+Cx) and cerebellar extracts (Cb) is shown. A, Immunoblot of the PS422 epitope (same lane assignments as in B; 3 replicate experiments). B, Immunoblot of Tau-C from Hc+Cx (lanes 1-3) and from Cb (lanes 4-6), both from 3-d-starved mice. C, Quantification of regional differences. The intensities of PS422 bands were normalized by total Tau-C and expressed as a percentage of the Hc+Cx fraction for each of the conditions (3-d-starved, insulin, and deoxyglucose-injected). Immunoblot data are not shown for insulin and deoxyglucosetreatments. Statistical analysis was performed with Student's t test. Data are means (n = 3 per condition) ± SD. Asterisks indicate significant differences from controls, with *p < 0.05 and **p < 0.01. Deox, Deoxyglucose.
Figure 1.
Figure 1.
Western blot analysis of tau phosphorylation during alterations of glucose metabolism. Proteins from mouse brain extracts (hippocampus plus neocortex) were separated by SDS-PAGE and identified with the following antibodies: a, Tau-1; b, PS199; c, AT8; d, AT100; e, PT231; f, PS262; g, PS396; h, PS404; i, PS422; j, Tau-C. Each lane shows an immunoblot extract from one representative mouse of four analyzed. A, Immunoblots from starved condition. Lane 1, Samples from fed control mice; lane 2, samples from mice starved for 3 d; lane 3, samples from mice starved for 3 d but given access to a 30% glucose solution. C, Insulin condition. Lane 1, Saline-injected control mice; lane 2, insulin-injected mice; lane 3, mice injected with a mixture of insulin and glucose. E, DG condition. Lane 1, Saline-injected control mice; lane 2, DG-injected mice; lane 3, glucose-injected mice. B, D, and F represent the quantification of immunoblot bands in A, C, and E, respectively. Data are means (n = 4 for each condition) ± SD. Asterisks indicate significant differences from controls, with *p < 0.05 and **p < 0.01. Each graph displays the immunoreactivity expressed as a percentage of the control lane 1 (100%). Numbers in the graphs indicate the percentage of the line with which they are aligned. N.D., Not determined.
Figure 3.
Figure 3.
Regional anatomical analysis of tau hyperphosphorylation. Fluorescence photomicrographs of sagittal sections are shown. A, Tau-1 (dephosphorylated tau) immunoreactivity in control (A1) and starved (A2) mouse. B, AT8 immunostaining in control (B1) and starved (B2) mouse. C, D, During starvation, tau hyperphosphorylation was localized in the axons of the cortex, corpus callosum, and striatum (C), and in the mossy fibers, alveus, and fimbria of the hippocampus (D), as demonstrated by double immunostaining with AT8 (red) and MAP2 (green). E1-G2 display tau immunoreactivity at different epitopes in the hippocampal region of a control mouse (1) or food-deprived mouse (2). E, AT8. F, AT100. G, Total tau. H1-J2 display AT8 immunoreactivity at the CA1-CA2 border region and mid-distal part of CA3 in control mice (H1,I1,J1), starved mice (H2), or mice injected with either insulin (I2) or deoxyglucose (J2).
Figure 4.
Figure 4.
Kinetic of tau phosphorylation in brain slices. Western blot analysis of AT8 and Tau-C epitopes in mouse brain slices incubated at 0, 5, 10, 30, and 60 min under different conditions is shown. A1-A4, DMEM with 25 mm glucose at 37°C (A1), DMEM without glucose at 37°C (A2), DMEM with 25 mm deoxyglucose at 37°C (A3), and DMEM with 25 mm glucose at 23°C (A4). B, The intensities of AT8 bands in A were normalized by Tau-C and expressed as a percentage of 0 min incubation time. Two repetitions of this experiment led to similar results. Glu., Glucose; NoGlu., no glucose; Deox, deoxyglucose.
Figure 5.
Figure 5.
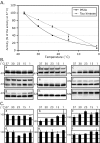
Characterization of the effect of temperature on tau phosphorylation in brain slices. Western blot analysis of mouse brain slices incubated in DMEM with 25 mm glucose for 60 min at 37, 30, 23, 15, and 1°C was analyzed at several tau epitopes. Each lane shows an immunoblot extract from one representative slice of three analyzed. A, Tau-1. B, PS199. C, AT8. D, PT231. E, PS422. F, Tau-C. G, The intensities of the bands in A-E were normalized by Tau-C and expressed as a percentage of incubation at 37°C. Data are means ± SD; n = 3.
Figure 6.
Figure 6.
Effect of low temperatures on the activities of brain PP2A and tau kinases and on the activation of four tau kinases. A, PP2A activity from brain extract was assayed at different temperatures and expressed as a percentage of incubation at 37°C (solid squares, plain line). The best fit was exponential, with a decay rate constant of 15.7°C (R2 > 0.99). The activity of brain tau kinases was assayed at different temperatures and expressed as a percentage of incubation at 37°C (solid triangles, dotted line). The best fit was linear, with a slope of 2.5%/°C (R2 > 0.98). Data are means ± SD; n = 3. B, The activation state of four major tau kinases was assessed by quantitative Western blotting of the same samples as in Figure 5, with antibodies recognizing the following kinases: a, GSK-3β; b, GSK-3α/β [pY219/pY216] (active form); c, phospho-GSK-3β (Ser9, inactive form); d, SAPK/JNK; e, phospho-SAPK/JNK (T183/Y185, active form); f, p44/42 MAP kinase; g, phospho-p44/42 MAPK (T202/Y204, active form); h, cdk-5; i, p35. Each lane shows an immunoblot extract from one representative slice of three analyzed. C, The intensities of the bands in B were quantified, normalized to the total kinase (except for cdk5 and p35), and expressed as a percentage of incubation at 37°C. a, GSK-3β pY216/GSK-3β; b, GSK-3β Ser9/GSK-3β; c, phospho-JNK/JNK (because phospho-p54 band was too faint, only p46 was quantified); d, phospho-MAPK/MAPK (p42 and p44 were quantified together); e, cdk5; f, p35. Data are means ± SD; n = 3.
Figure 7.
Figure 7.
Western blot analysis of tau kinases during alterations of glucose metabolism. 1, Proteins from mouse brain extracts (hippocampus plus neocortex) were separated by SDS-PAGE and identified with the following antibodies: a, GSK-3β pY216; b, GSK-3β Ser9; c, phospho-SAPK/JNK (T183/Y185, active form); d, phospho-p44/42 MAPK (T202/Y204, active form); e, cdk5; f, p35. Each lane shows an immunoblot extract from one representative mouse of four analyzed. Total GSK-3β, JNK, and MAPK were also analyzed and quantified (data not shown). A, Immunoblots from starved condition. Lane 1, Samples from fed control mice; lane 2, samples from mice starved for 3 d; lane 3, samples from mice starved for 3 d but given access to a 30% glucose solution. C, Insulin condition. Lane 1, Saline-injected control mice; lane 2, insulin-injected mice; lane 3, mice injected with a mixture of insulin and glucose. E, DG condition. Lane 1, Saline-injected control mice; lane 2, DG-injected mice; lane 3, glucose-injected mice. B, D, F, The intensities of the bands in A, C, and E were quantified and normalized to the total kinase (except for cdk5 and p35). a, GSK-3β pY216/GSK-3β; b, GSK-3β Ser9/GSK-3β; c, phospho-JNK/JNK (open columns, p46; plain columns, p54); d, phospho-MAPK/MAPK (p42 and p44 were quantified together); e, cdk5; f, p35. Data are means ± SD (n = 4 for each condition). Asterisks indicate significant differences from controls, with *p < 0.05 and **p < 0.01. Each graph displays the immunoreactivity expressed as a percentage of the control lane 1 (100%). Numbers in the graphs indicate the percentage of the line with which they are aligned.
Figure 8.
Figure 8.
Effect of placement at 37°C on tau phosphorylation during starvation (Starv.), insulin, or DG (Deox.) treatments. Western blot of brains extracts from mice placed at 37°C after treatment is shown. Placement at 37°C allowed the rectal temperature to stabilize around control values for all treatments (data not shown). A, Starvation. B, Insulin injections. C, Deoxyglucose injections. Lanes 1 and 2, Controls; lanes 3 and 4, treatments; lanes 5 and 6, treatments and placement at 37°C. Each lane represents one individual animal. Antibodies used are indicated on the left side.

References

    1. Alonso AC, Zaidi T, Novak M, Grundke-Iqbal I, Iqbal K (2001) Hyperphosphorylation induces self-assembly of tau into tangles of paired helical filaments/straight filaments. Proc Natl Acad Sci USA 98: 6923-6928. - PMC - PubMed
    1. Arendt T, Holzer M, Fruth R, Bruckner MK, Gartner U (1998) Phosphorylation of tau, Abeta-formation, and apoptosis after in vivo inhibition of PP-1 and PP-2A. Neurobiol Aging 19: 3-13. - PubMed
    1. Arendt T, Stieler J, Strijkstra AM, Hut RA, Rudiger J, Van der Zee EA, Harkany T, Holzer M, Hartig W (2003) Reversible paired helical filament-like phosphorylation of tau is an adaptive process associated with neuronal plasticity in hibernating animals. J Neurosci 23: 6972-6981. - PMC - PubMed
    1. Auer RN, Siesjo BK (1993) Hypoglycaemia: brain neurochemistry and neuropathology. Baillieres Clin Endocrinol Metab 7: 611-625. - PubMed
    1. Bancher C, Brunner C, Lassmann H, Budka H, Jellinger K, Wiche G, Seitelberger F, Grundke-Iqbal I, Iqbal K, Wisniewski HM (1989) Accumulation of abnormally phosphorylated tau precedes the formation of neurofibrillary tangles in Alzheimer's disease. Brain Res 477: 90-99. - PubMed

Publication types

MeSH terms