. 2004 Mar 10;24(10):2496-505.
doi: 10.1523/JNEUROSCI.5372-03.2004.

Synaptic vesicles: test for a role in presynaptic calcium regulation

Affiliations

Synaptic vesicles: test for a role in presynaptic calcium regulation

Greg T Macleod et al. J Neurosci. .

Abstract

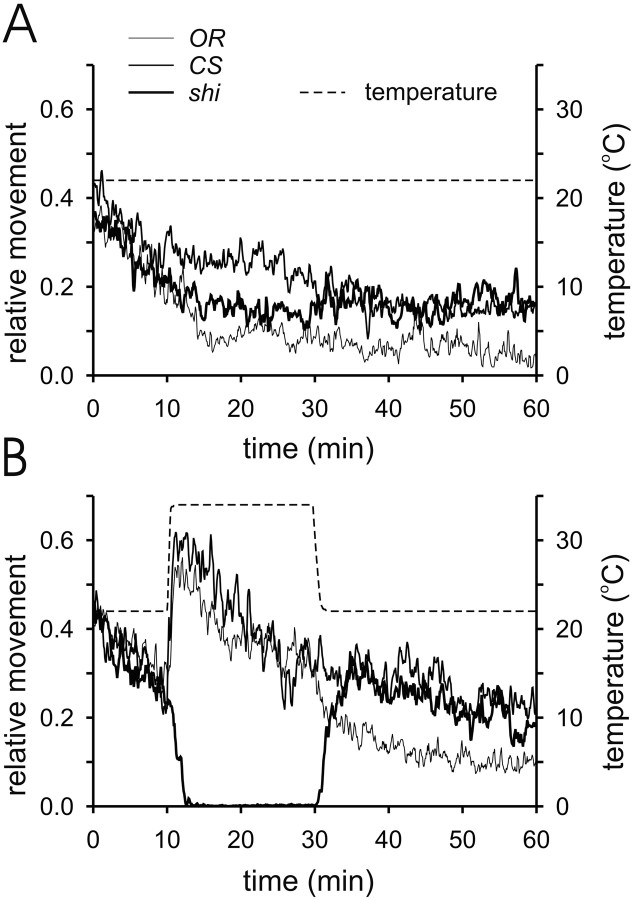
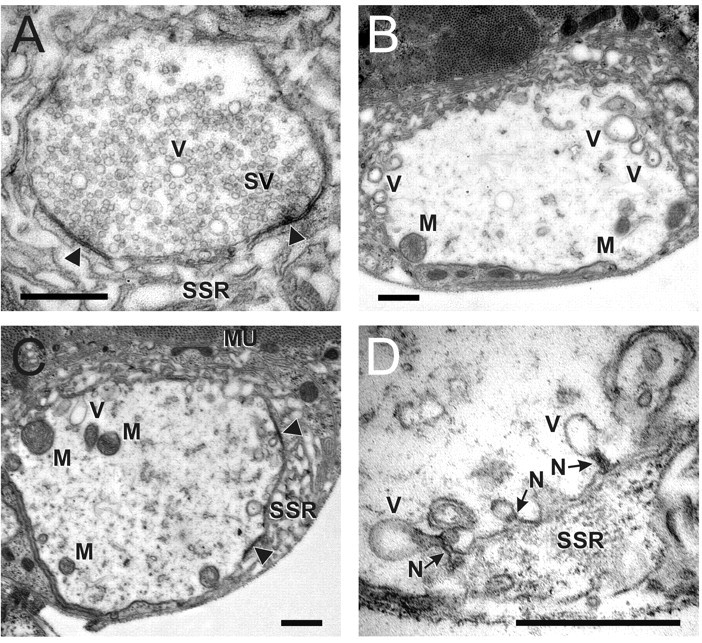
Membrane-bound organelles such as mitochondria and the endoplasmic reticulum play an important role in neuronal Ca(2+) homeostasis. Synaptic vesicles (SVs), the organelles responsible for exocytosis of neurotransmitters, occupy more of the volume of presynaptic nerve terminals than any other organelle and, under some conditions, can accumulate Ca(2+). They are also closely associated with voltage-gated Ca(2+) channels (VGCCs) that trigger transmitter release by admitting Ca(2+) into the nerve terminal in response to action potentials (APs). We tested the hypothesis that SVs can modulate Ca(2+) signals in the presynaptic terminal. This has been a difficult question to address because neither pharmacological nor genetic approaches to block Ca(2+) permeation of the SV membrane have been available. To investigate the possible role of SVs in Ca(2+) regulation, we used imaging techniques to compare Ca(2+) dynamics in motor nerve terminals before and after depletion of SVs. We used the temperature-sensitive Drosophila dynamin mutant shibire, in which SVs can be eliminated by stimulation. There was no difference in the amplitude or time course of Ca(2+) responses during high-frequency trains of APs, or single APs, in individual presynaptic boutons before and after depletion of SVs. SVs have a limited role, if any, in the rapid sequestration of Ca(2+) within the neuronal cytosol or the synaptic microdomain. We also conclude that SVs are not important for regulation of synaptic VGCCs.


Figures

Figure 1.
Figure 1.
Activity of shi, OR, and CS larvae was similar at room temperature, but shi larvae exhibited reversible paralysis at a nonpermissive temperature. A, Average relative movement of larvae over a 60 min period at a constant temperature of 22°C. Each jagged trace (plotted against the left ordinate) represents the average of four trials of five larvae, smoothed with a three-point moving average. B, Average relative movement of larvae during a stepped temperature cycle, from 22°C up to 34°C and back down to 22°C. Temperature is indicated by the right ordinate. Time = 0 (minutes) corresponds to ∼10 min after the larvae were placed in the chamber.
Figure 3.
Figure 3.
Nerve terminals of shi larvae, depleted of synaptic vesicles, exhibit robust Ca2+ signals at nonpermissive temperatures. A, Sequentially scanned images (680 msec interval) of OGB-1-loaded boutons in the cleft between muscles 6 and 7, at the end of a 6 min 30 Hz depletion train (horizontal black bar) at 34°C. The third image (*) is the last taken during the depletion train. After stimulation is stopped, the fluorescence rapidly declines. The bouton boxed in the sixth image was chosen for analysis over the image sequence. The fluorescence intensity of pixels (0-255) is represented in the lookup table on the right. B, The change in fluorescence (ΔF) divided by the stimulated fluorescence level (FS) is plotted (ΔF/FS) for the example shown in A (filled circles) and for an average of five boutons in as many different larval preparations (open circles). FS is normalized to 1. SD is indicated. C, Sequentially scanned images of OGB-1-loaded boutons (muscles 6/7), still at 34°C, during a train of 40 pulses at 20 Hz delivered 2 min after the end of a 6 min depletion train. Note the white vertical scan line in the second panel marking the time of the first pulse in the 40 pulse train. Fluorescence increases rapidly as soon as stimulation is commenced. D, The change in fluorescence (ΔF) divided by the resting fluorescence level (FR) is plotted (ΔF/FR) for the example shown (bouton within region of interest shown in sixth image of C). Average ΔF/FR is plotted against frequency of stimulation for depleted boutons in three other larval preparations under identical conditions (inset). SE is indicated. Scale bars: A, C, 10 μm. All measurements were made in HL6 with 2 mm [Ca2+]o and 4 mm [Mg2+]o.
Figure 4.
Figure 4.
Ca2+ accumulation in shi nerve terminals during stimulation is reduced at 34°C before synaptic vesicle depletion. A, A representation of changes in temperature, [Ca2+]o, and [Mg2+]o over time relative to the measurements reported in B (not to scale). The location of the solid horizontal bar indicates the conditions under which a sustained train of stimulating pulses was applied to the segmental nerve to deplete nerve terminals of vesicles. B, Plots of the OGB-1 ΔF/FR response to trains of 40 pulses at 20 Hz under four different conditions (indicated below each abscissa), corresponding to the conditions indicated in A. Each of the bars in the first plot is paired (same boutons) with a bar in a plot to the right. n > 5 for each of the pairs of bars. All significant differences (p < 0.05; t test) between measurements are indicated with a joining line. All measurements were made in HL6 with 0.5 mm [Ca2+]o and 15 mm [Mg2+]o.
Figure 5.
Figure 5.
Ca2+ transients during stimulus trains in synaptic vesicle-depleted nerve terminals do not differ greatly from controls. Ai, An image of fluorescence from a type-1b bouton filled with OGB-1. Aii, Sequential line scans through the center of the bouton. The white vertical scan line is coincident in time with the first pulse of an 80 pulse train delivered to the segment nerve of a shi larva at 80 Hz, at a temperature of 34°C. Lookup table to the right (0-255). Aiii, ΔF/FR plotted for each vertical scan line in A. B, Stimulation-dependent changes in OGB-1 fluorescence from a type-1b shi bouton (Bi) depleted of vesicles at a temperature of 34°C. Bii and Biii are as in Aii and Aiii. C, Stimulation-dependent changes in OGB-1 fluorescence from a type-1b OR bouton (Ci) at 34°C, previously subjected to the standard depletion protocol. Cii and Ciii are as in Aii and Aiii. Maximum relative fluorescence changes are similar in all cases. All line scanning is performed at 4 msec per line. Scale bar (in C): A-C, 2 μm.
Figure 6.
Figure 6.
A comparison of the average time course of changes in OGB-1 fluorescence, in response to short stimulation trains, between depleted shi nerve terminal boutons at 34°C and control preparations at 34°C. A, The average plot of ΔF/FR for line scans through shi nondepleted boutons (n = 4), shi depleted boutons (n = 5), and OR boutons subjected to previous depletion stimulation (n = 4), during stimulus trains of 80 pulses at 80 Hz. B, The same traces as in A normalized to the average amplitude of the OGB-1 response over the last 200 msec of the stimulation train. C-E, Plots of the average bouton OGB-1 fluorescence response for each treatment. C, Maximum ΔF/FR amplitude; D, time taken to rise 20-80% of ΔF/FR maximum; E, time constant of decay after the 80th pulse.
Figure 7.
Figure 7.
The concentration of free Ca2+ in the nerve terminals remains submicromolar during high-frequency stimulation at 22°C. A, Images of fura-dextran-filled type-1b boutons acquired through a 530 ± 35 nm bandpass filter, while they were exposed to excitation illumination through a 340 ± 5 nm filter. Ai, Before stimulation; Aii, during stimulation at 80 Hz; Aiii, after stimulation. [Ca2+]o of 2 mm. B, Images of the same boutons as in A, acquired through a 530 ± 35 nm filter, while they were illuminated through a 380 ± 5 nm filter. Bi-Biii as in Ai-Aiii. Scale bar: A, B,10 μm. Lookup table on the right-hand side. C, A plot of ΔF/FR for the most distal type-1b bouton, before, during, and after a train of 400 pulses at 80 Hz (filled circles, 340 nm excitation; open circles, 380 nm excitation). Image pairs in A and B correspond to boxed plotted values in C: i, 2nd; ii, 5th; iii, 10th. D, A plot of [Ca2+]i against time, for each image pair, estimated from the ratio of the fluorescence of the bouton in A to that in B. E, A plot of average [Ca2+]i against time for OR (black; n = 6) and shi (red; n = 7) type-1b boutons in 0.5 mm [Ca2+]o. F, A plot of average [Ca2+]i against time for OR type-1b boutons (n = 8) in 2 mm [Ca2+]o. SE is indicated.
Figure 8.
Figure 8.
Ca2+ transients during single stimulus pulses in synaptic vesicle-depleted terminal boutons are indistinguishable from those in nondepleted boutons at 34°C. Ai, An image of fluorescence from a type-1b bouton filled with OGB-1. Scale bar, 2 μm. Aii, Sequential line scans through the center of the bouton. The white vertical scan line is coincident in time with a single pulse delivered to the segmental nerve of a shi larva at a temperature of 22°C. Lookup table to the right (0-255). Aiii, ΔF/FR plotted for each vertical scan line in Aii. B, A plot of the average ΔF/FR amplitude in response to a single pulse in shi boutons at 22°C and at 34°C (depleted and undepleted boutons); the number of preparations (n) for each condition is indicated on each bar. C, A plot of the average decay time constant in response to a single pulse in shi boutons; number of preparations as in B (*p < 0.05; unpaired t tests). There were no differences in Ca2+ signals between depleted and undepleted boutons at 34°C.
Figure 2.
Figure 2.
Stimulation at nonpermissive temperatures leads to complete depletion of synaptic vesicles in nerve terminals of shi larvae. Thin section electron micrographs. A, Type-1b bouton in segment 2 (nonstimulated) with full complement of SVs, fixed after ∼10 min at 34°C. Two synaptic contacts (arrowheads) are present, contacting processes of the subsynaptic reticulum (SSR), which is an extension of the muscle fiber (MU). A few large vesicles (V) are disbursed among the SVs. B, C, Similar type-1b boutons in segment 3 (muscle 6/7) of the same preparation, loaded with OGB-1 and depleted of SVs by stimulating the segmental nerve at 30 Hz for 6 min. Numerous prominent vesicles (V) appear near the presynaptic bounding membrane; mitochondria (M) appear normal. No SVs were found anywhere in the presynaptic terminal. D, Higher magnification to illustrate membranous structures issuing from the plasma membrane of a depleted type-1b bouton. Sac-like structures of variable morphology remain confluent with the extracellular space. Several prominent electron-dense necks (N) are evident at the junction of sac-like vesicular structures (V) and the surface membrane. Scale bars, 0.5 μm.

Similar articles

Cited by

References

    1. Adler EM, Augustine GJ, Duffy SN, Charlton MP (1991) Alien intracellular calcium chelators attenuate neurotransmitter release at the squid giant synapse. J Neurosci 11: 1496-1507. - PMC - PubMed
    1. Atwood HL, Govind CK, Wu C-F (1993) Differential ultrastructure of synaptic terminals on ventral longitudinal abdominal muscles in Drosophila larvae. J Neurobiol 24: 1008-1024. - PubMed
    1. Barclay JW, Atwood HL, Robertson RM (2002) Impairment of central pattern generation in Drosophila cysteine string protein mutants. J Comp Physiol 88: 71-78. - PubMed
    1. Bennett MR, Farnell L, Gibson WG (2000) The probability of quantal secretion near a single calcium channel of an active zone. Biophys J 78: 2201-2221. - PMC - PubMed
    1. Berridge MJ, Bootman MD, Roderick HL (2003) Calcium signalling: dynamics, homeostasis and remodelling. Nat Rev Mol Cell Biol 4: 517-529. - PubMed

Publication types