. 2004 Apr;74(4):610-22.
doi: 10.1086/382227. Epub 2004 Mar 10.

Haplotype diversity across 100 candidate genes for inflammation, lipid metabolism, and blood pressure regulation in two populations

Affiliations

Haplotype diversity across 100 candidate genes for inflammation, lipid metabolism, and blood pressure regulation in two populations

Dana C Crawford et al. Am J Hum Genet. 2004 Apr.

Abstract

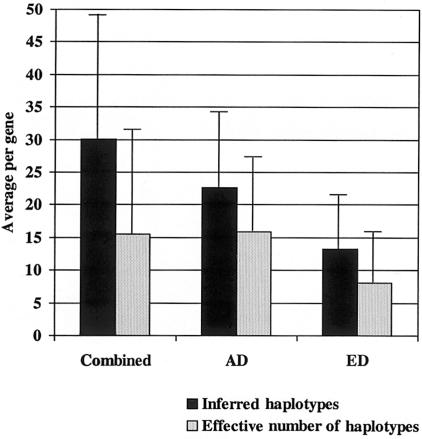
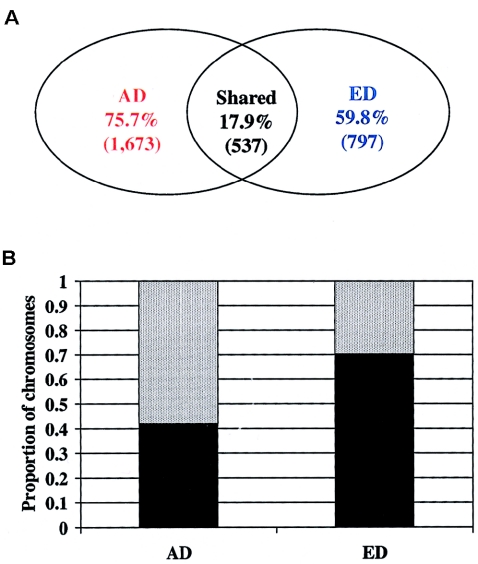
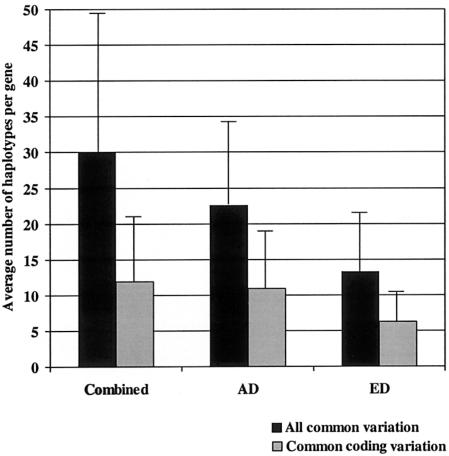
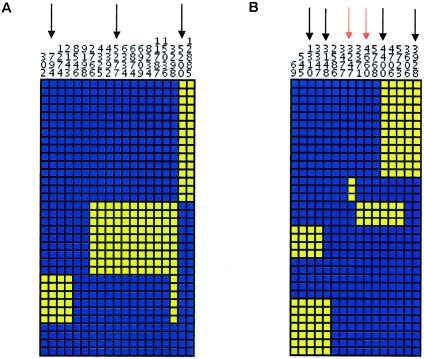
Recent studies have suggested that a significant fraction of the human genome is contained in blocks of strong linkage disequilibrium, ranging from ~5 to >100 kb in length, and that within these blocks a few common haplotypes may account for >90% of the observed haplotypes. Furthermore, previous studies have suggested that common haplotypes in candidate genes are generally shared across populations and represent the majority of chromosomes in each population. The conclusions drawn from these preliminary studies, however, are based on an incomplete knowledge of the variation in the regions examined. To bridge this gap in knowledge, we have completely resequenced 100 candidate genes in a population of African descent and one of European descent. Although these genes have been well studied because of their medical importance, we demonstrate that a large amount of sequence variation has not yet been described. We also report that the average number of inferred haplotypes per gene, when complete data is used, is higher than in previous reports and that the number and proportion of all haplotypes represented by common haplotypes per gene is variable. Furthermore, we demonstrate that haplotypes shared between the two populations constitute only a fraction of the total number of haplotypes observed and that these shared haplotypes represent fewer of the African-descent chromosomes than was expected from previous studies. Finally, we show that restricting variation discovery to coding regions does not adequately describe all common haplotypes or the true haplotype block structure observed when all common variation is used to infer haplotypes. These data, derived from complete knowledge of genetic variation in these genes, suggest that the haplotype architecture of candidate genes across the human genome is more complex than previously suggested, with important implications for candidate gene and genomewide association studies.


Figures

Figure  1
Figure 1
The average number of haplotypes (blackened bars) and effective haplotypes (gray bars) per gene inferred from common SNPs (MAF >5%), by population. X-axis: population; Y-axis: the average number per gene. The thin bars represent the standard deviation.
Figure  2
Figure 2
The number of haplotypes per gene in the ED population is positively correlated with the number of haplotypes per gene in the AD population. However, the correlation is not perfect (R2=0.62), and it identifies genes in which the number of haplotypes per gene differs dramatically between the two populations. X-axis: number of haplotypes inferred by PHASE per gene in the AD population (MAF >5%); Y-axis: number of haplotypes inferred by PHASE per gene in the ED population (MAF >5%).
Figure  3
Figure 3
a, Percentage (number) of shared haplotypes and population specific haplotypes inferred from SNPs with MAF >5% (red, AD population–specific haplotypes; blue, ED population–specific haplotypes). b, The frequency of chromosomes represented among the shared (blackened bars) and nonshared (gray bars) haplotypes inferred from SNPs with MAF >5%, by population. X-axis: population; Y-axis: proportion of chromosomes represented.
Figure  4
Figure 4
The average number of haplotypes per gene (MAF >5%) using all common variation (blackened bars) and common coding variation (gray bars), by population. X-axis: population; Y-axis: the average number of haplotypes per gene (MAF >5%). The thin bars represent the standard deviation.
Figure  5
Figure 5
Visual depiction of the common haplotypes inferred from SNPs with MAF >5% in IL1B from the ED population (a) and CSF2 from the AD population (b). Each column represents a SNP, with the minor allele colored yellow and the common allele colored blue. Each row represents a chromosome. Sites within the gene were clustered on the basis of allelic similarity, and haplotypes were clustered using the unweighted pair group method with arithmetic averages. a, Four common haplotypes (>5% frequency) were observed in the ED population for IL1B from all common variation at MAF >5%. The black arrows represent tagSNPs that distinguish the four common haplotypes whose corresponding sites were also found among the coding variation data set. b, Six common haplotypes (>5% frequency) were observed in the AD population for CSF2 from all common variation at MAF >5%. Six tagSNPs were identified that distinguish common haplotypes. The black arrows represent the tagSNPs that distinguish common haplotypes whose corresponding sites were also found among the coding variation data set. The red arrows represent the tagSNPs that distinguish common haplotypes whose corresponding sites were not found among the coding variation data set.

References

Electronic-Database Information

    1. dbSNP, http://www.ncbi.nlm.nih.gov/SNP/
    1. GenBank, http://www.ncbi.nlm.nih.gov/Genbank/ (accession numbers for all genes are listed in [online only])
    1. HaploBlockFinder V0.6b, http://cgi.uc.edu/cgi-bin/kzhang/haploBlockFinder.cgi/
    1. Nickerson Group, http://droog.gs.washington.edu
    1. Pharmacogenetics Research Network, http://www.nigms.nih.gov/pharmacogenetics/

References

    1. Bonnen PE, Wang PJ, Kimmel M, Chakraborty R, Nelson DL (2002) Haplotype and linkage disequilibrium architecture for human cancer-associated genes. Genome Res 12:1846–185310.1101/gr.483802 - DOI - PMC - PubMed
    1. Botstein D, Risch N (2003) Discovering genotypes underlying human phenotypes: past successes for mendelian disease, future approaches for complex disease. Nat Genet Suppl 33:228–23710.1038/ng1090 - DOI - PubMed
    1. Cambien F, Poirier O, Nicaud V, Herrmann SM, Mallet C, Ricard S, Behague I, Hallet V, Blanc H, Loukaci V, Thillet J, Evans A, Ruidavets JB, Arveiler D, Luc G, Tiret L (1999) Sequence diversity in 36 candidate genes for cardiovascular disorders. Am J Hum Genet 65:183–191 - PMC - PubMed
    1. Cardon LR, Bell JI (2001) Association study designs for complex diseases. Nat Rev Genet 2:91–9910.1038/35052543 - DOI - PubMed
    1. Cargill M, Altshuler D, Ireland J, Sklar P, Ardlie K, Patil N, Shaw N, Lane CR, Lim EP, Kalyanaraman N, Nemesh J, Ziaugra L, Friedland L, Rolfe A, Warrington J, Lipshutz R, Daley GQ, Lander ES (1999) Characterization of single-nucleotide polymorphisms in coding regions of human genes. Nat Genet 22:231–23810.1038/10290 - DOI - PubMed

Publication types