

Role of interleukin-4 (IL-4) and IL-10 in serum immunoglobulin G antibody responses following mucosal or systemic reovirus infection
- PMID: 15016857
- PMCID: PMC371054
- DOI: 10.1128/jvi.78.7.3352-3360.2004
Role of interleukin-4 (IL-4) and IL-10 in serum immunoglobulin G antibody responses following mucosal or systemic reovirus infection
Abstract
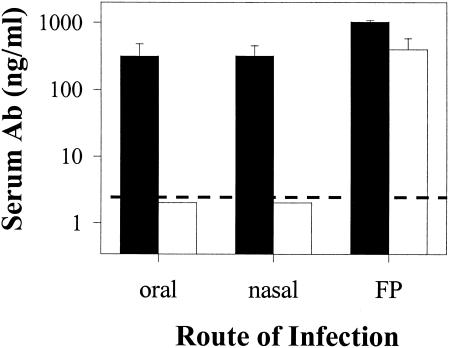
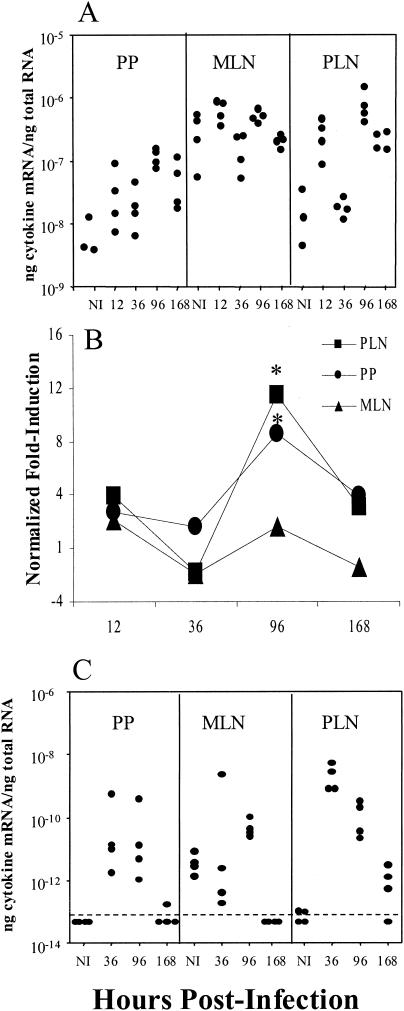
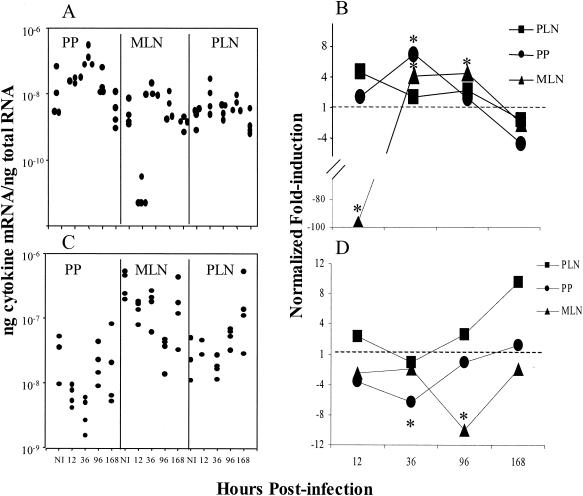
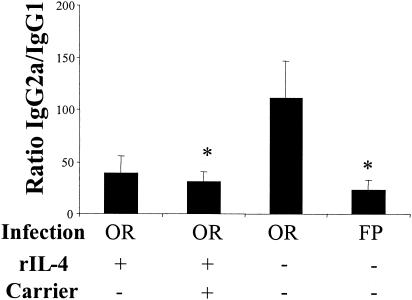
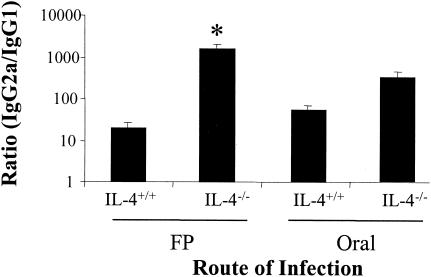
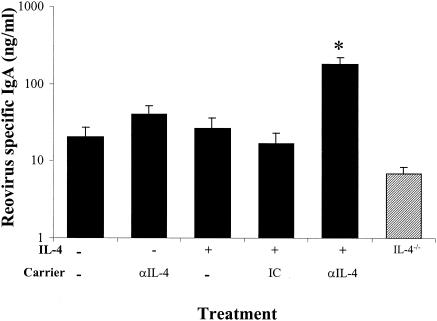
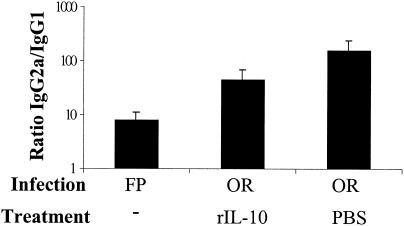
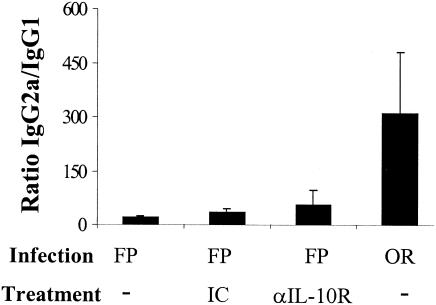
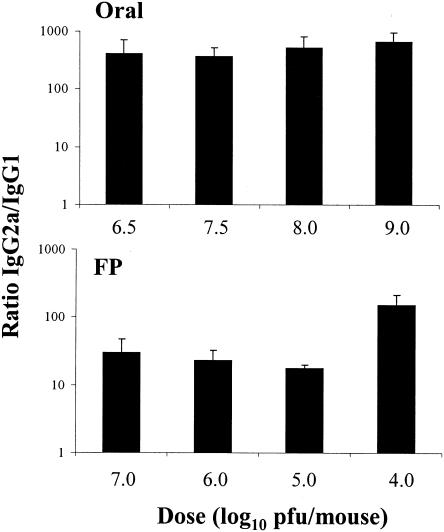
Mucosal and parenteral immunizations elicit qualitatively distinct immune responses, and there is evidence that mucosal immunization can skew the balance of T helper 1 and T helper 2 responses. However, a clear picture of the effect of the route of infection on the balance of the T helper responses has not yet emerged. Our laboratory previously demonstrated that oral reovirus infection elicits specific serum immunoglobulin G2a (IgG2a), while parenteral reovirus infection elicits the mixed production of specific serum IgG2a and IgG1 in mice of the H-2(d) haplotype. Knowing that IgG2a production is indicative of a T helper 1 response and IgG1 production is indicative of a T helper 2 response, we hypothesized that the route of infection influences the development of T helper 1 and T helper 2 responses. Using quantitative reverse transcription-PCR, we found that mRNA for the T helper 1 cytokines gamma interferon and interleukin-12 (IL-12) were expressed in draining lymphoid tissues following both oral and parenteral infections. However, we observed that mRNA for the T helper 2 cytokine IL-10 was suppressed in the Peyer's patches and mesenteric lymph nodes and IL-4 mRNA was suppressed in the mesenteric lymph nodes compared to noninfected controls, following oral infection. Using recombinant cytokines and cytokine knockout mice, we confirmed that IL-4 plays a major role in mediating the route-of-infection-dependent differences in serum IgG subclass responses. Therefore, the route of infection needs to be taken into consideration when developing vaccines and adjuvant therapies.
Figures
Similar articles
-
Oral immunization of interleukin-4 (IL-4) knockout mice with a recombinant Salmonella strain or cholera toxin reveals that CD4+ Th2 cells producing IL-6 and IL-10 are associated with mucosal immunoglobulin A responses.Infect Immun. 1996 May;64(5):1516-25. doi: 10.1128/iai.64.5.1516-1525.1996. Infect Immun. 1996. PMID: 8613355 Free PMC article.
-
Effects of the route of infection on immunoglobulin G subclasses and specificity of the reovirus-specific humoral immune response.J Virol. 1996 Sep;70(9):5968-74. doi: 10.1128/JVI.70.9.5968-5974.1996. J Virol. 1996. PMID: 8709219 Free PMC article.
-
Interleukin-4 plays a dominant role in Th1- or Th2-like responses during the primary immune response to the hapten penicillin.Mol Immunol. 1996 Jan;33(1):71-7. doi: 10.1016/0161-5890(95)00119-0. Mol Immunol. 1996. PMID: 8604226
-
The role of Th1 and Th2 cells for mucosal IgA responses.Ann N Y Acad Sci. 1996 Feb 13;778:64-71. doi: 10.1111/j.1749-6632.1996.tb21115.x. Ann N Y Acad Sci. 1996. PMID: 8611017 Review.
-
Antagonizing the differentiation and functions of human T helper type 2 cells.Curr Opin Immunol. 1995 Dec;7(6):771-8. doi: 10.1016/0952-7915(95)80046-8. Curr Opin Immunol. 1995. PMID: 8679118 Review.
Cited by
-
Blocking interleukin-4 enhances efficacy of vaccines for treatment of opioid abuse and prevention of opioid overdose.Sci Rep. 2018 Apr 3;8(1):5508. doi: 10.1038/s41598-018-23777-6. Sci Rep. 2018. PMID: 29615715 Free PMC article.
-
Enteric reovirus infection stimulates peanut-specific IgG2a responses in a mouse food allergy model.Immunobiology. 2010 Dec;215(12):941-8. doi: 10.1016/j.imbio.2010.02.004. Epub 2010 Mar 4. Immunobiology. 2010. PMID: 20356650 Free PMC article.
-
Recombinant Lactococcus Lactis Displaying Omp31 Antigen of Brucella melitensis Can Induce an Immunogenic Response in BALB/c Mice.Probiotics Antimicrob Proteins. 2021 Feb;13(1):80-89. doi: 10.1007/s12602-020-09684-1. Probiotics Antimicrob Proteins. 2021. PMID: 32661939
-
Immunoadjuvant Activity of Fucoidans from the Brown Alga Fucus evanescens.Mar Drugs. 2020 Mar 11;18(3):155. doi: 10.3390/md18030155. Mar Drugs. 2020. PMID: 32168741 Free PMC article.
-
SARS-CoV-2 disease severity and transmission efficiency is increased for airborne compared to fomite exposure in Syrian hamsters.Nat Commun. 2021 Aug 17;12(1):4985. doi: 10.1038/s41467-021-25156-8. Nat Commun. 2021. PMID: 34404778 Free PMC article.
References
-
- Boyaka, P. N., M. Marinaro, R. J. Jackson, F. W. van Ginkel, E. Cormet-Boyaka, K. L. Kirk, C. R. Kensil, and J. R. McGhee. 2001. Oral QS-21 requires early IL-4 help for induction of mucosal and systemic immunity. J. Immunol. 166:2283-2290. - PubMed
-
- Bustin, S. A. 2000. Absolute quantification of mRNA using real-time reverse transcription polymerase chain reaction assays. J. Mol. Endocrinol. 25:169-193. - PubMed
-
- Chen, W., D. Shu, and V. S. Chadwick. 1999. Helicobacter pylori infection in interleukin-4-deficient and transgenic mice. Scand. J. Gastroenterol. 34:987-992. - PubMed
-
- Coffman, R. L., B. Shrader, J. Carty, T. R. Mosmann, and M. W. Bond. 1987. A mouse T cell product that preferentially enhances IgA production. I. Biologic characterization. J. Immunol. 139:3685-3690. - PubMed
Publication types
MeSH terms
Substances
Grants and funding
LinkOut - more resources
Full Text Sources
