. 2004 Apr;78(7):3407-18.
doi: 10.1128/jvi.78.7.3407-3418.2004.

PU.1 binding to ets motifs within the equine infectious anemia virus long terminal repeat (LTR) enhancer: regulation of LTR activity and virus replication in macrophages

Affiliations

PU.1 binding to ets motifs within the equine infectious anemia virus long terminal repeat (LTR) enhancer: regulation of LTR activity and virus replication in macrophages

Robert Hines et al. J Virol. 2004 Apr.

Abstract

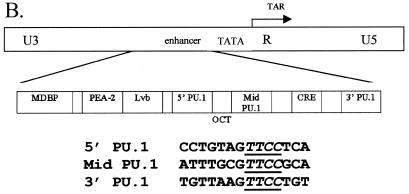
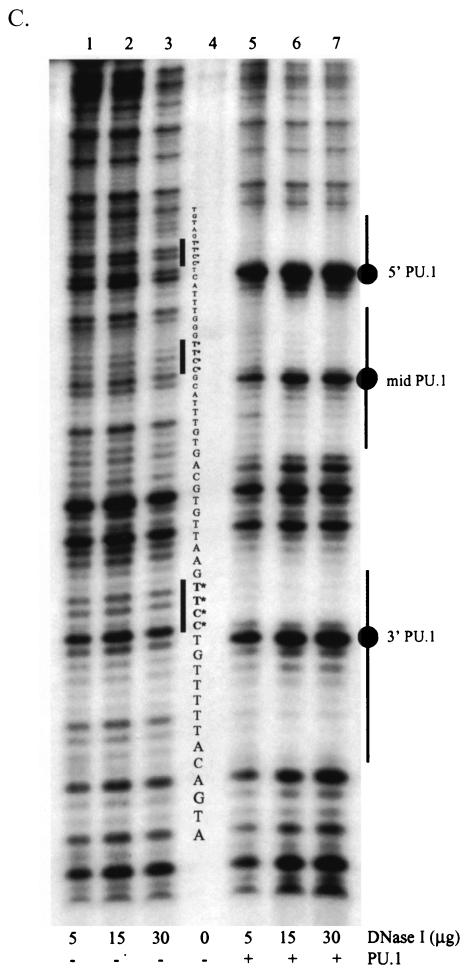
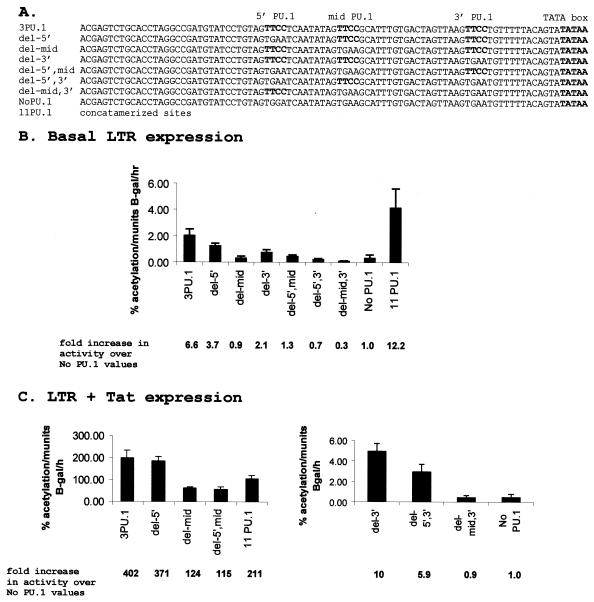
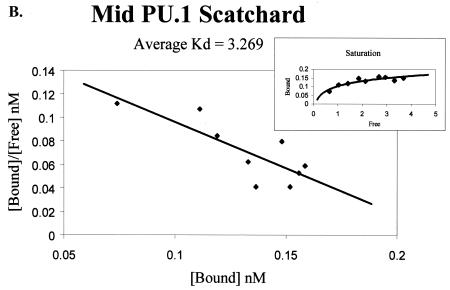
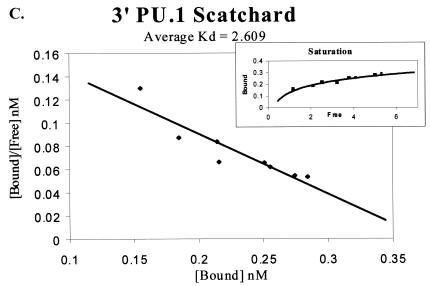
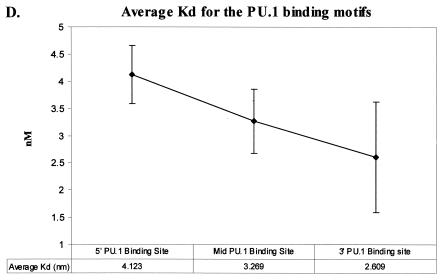
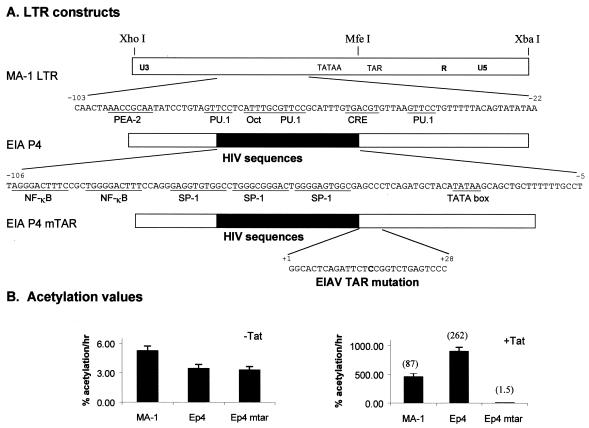
Binding of the transcription factor PU.1 to its DNA binding motif regulates the expression of a number of B-cell- and myeloid-specific genes. The long terminal repeat (LTR) of macrophage-tropic strains of equine infectious anemia virus (EIAV) contains three PU.1 binding sites, namely an invariant promoter-proximal site as well as two upstream sites. We have previously shown that these sites are important for EIAV LTR activity in primary macrophages (W. Maury, J. Virol. 68:6270-6279, 1994). Since the sequences present in these three binding motifs are not identical, we sought to determine the role of these three sites in EIAV LTR activity. While DNase I footprinting studies indicated that all three sites within the enhancer were bound by recombinant PU.1, reporter gene assays demonstrated that the middle motif was most important for basal levels of LTR activity in macrophages and that the 5' motif had little impact. The impact of the 3' site became evident in Tat transactivation studies, in which the loss of the site reduced Tat-transactivated expression 40-fold. In contrast, elimination of the 5' site had no effect on Tat-mediated activity. Binding studies were performed to determine whether differences in PU.1 binding affinity for the three sites correlated with the relative impact of each site on LTR transcription. While small differences were observed in the binding affinities of the three sites, with the promoter-proximal site having the strongest binding affinity, these differences could not account for the dramatic differences observed in the transcriptional effects. Instead, the promoter-proximal position of the 3' motif appeared to be critical for its transcriptional impact and suggested that the PU.1 sites may serve different roles depending upon the location of the sites within the enhancer. Infectivity studies demonstrated that an LTR containing an enhancer composed of the three PU.1 sites was not sufficient to drive viral replication in macrophages. These findings indicate that while the promoter-proximal PU.1 site is the most critical site for EIAV LTR activity in the presence of Tat, other elements within the enhancer are needed for EIAV replication in macrophages.


Figures

FIG. 1.
FIG. 1.
PU.1 interactions with EIAV ets motifs. (A) Model of the interaction of the PU.1 binding domain with the three EIAV binding motifs. The binding domain of PU.1, as determined by Kodandapani et al. (24), was modeled onto B-form DNA. The second helix of a helix-turn-helix motif of PU.1 binds in the major groove of the helix through interactions with the core ets motif (GGAA) that is present on the antisense strand of the EIAV enhancer. (B) Schematic of the EIAV LTR and the nucleotide sequences of the EIAV LTR enhancer ets or PU.1 sites. The Oct motif is identified below the construct because the site physically overlaps both the 5′ and middle PU.1 sites. The empty blocks within the enhancer represent 3- to 5-bp blocks of DNA that are not believed to be involved with transcription factor binding. (C) DNase I protection of the EIAV enhancer region complexed with recombinant PU.1 protein. Lanes 1 to 3, increasing concentrations of DNase I in the absence of PU.1; lane 4, probe that was not treated with DNase; lanes 5 to 7, increasing concentrations of DNase I in the presence of recombinant PU.1. The 5′ to 3′ EIAV LTR enhancer nucleotide sequence is shown in the center of the figure. Hypersensitive regions (circles) as well as PU.1-protected nucleotides (bars) at each of the three PU.1 motifs are indicated.
FIG. 1.
FIG. 1.
PU.1 interactions with EIAV ets motifs. (A) Model of the interaction of the PU.1 binding domain with the three EIAV binding motifs. The binding domain of PU.1, as determined by Kodandapani et al. (24), was modeled onto B-form DNA. The second helix of a helix-turn-helix motif of PU.1 binds in the major groove of the helix through interactions with the core ets motif (GGAA) that is present on the antisense strand of the EIAV enhancer. (B) Schematic of the EIAV LTR and the nucleotide sequences of the EIAV LTR enhancer ets or PU.1 sites. The Oct motif is identified below the construct because the site physically overlaps both the 5′ and middle PU.1 sites. The empty blocks within the enhancer represent 3- to 5-bp blocks of DNA that are not believed to be involved with transcription factor binding. (C) DNase I protection of the EIAV enhancer region complexed with recombinant PU.1 protein. Lanes 1 to 3, increasing concentrations of DNase I in the absence of PU.1; lane 4, probe that was not treated with DNase; lanes 5 to 7, increasing concentrations of DNase I in the presence of recombinant PU.1. The 5′ to 3′ EIAV LTR enhancer nucleotide sequence is shown in the center of the figure. Hypersensitive regions (circles) as well as PU.1-protected nucleotides (bars) at each of the three PU.1 motifs are indicated.
FIG. 2.
FIG. 2.
PU.1 binding motifs in the EIAV enhancer differentially impact LTR activity in the canine macrophage cell line DH82. (A) Enhancer sequences tested for activity within the context of LTR/CAT constructs. (B) Basal levels of LTR activity. (C) Tat-transactivated levels of LTR activity of constructs containing the promoter-proximal (3′) PU.1 binding site (left panel) and constructs that do not contain the promoter-proximal (3′) PU.1 binding site (right panel).
FIG. 3.
FIG. 3.
Scatchard analysis of recombinant PU.1 binding to the three PU.1 binding motifs in the EIAV LTR. (A) Representative Scatchard plot of PU.1 binding to the 5′ PU.1 binding motif. The average disassociation constant was determined to be 4.123 nM. (B) Representative Scatchard plot of PU.1 binding to the middle PU.1 binding motif. The average disassociation constant was determined to be 3.269 nM. (C) Representative Scatchard plot of PU.1 binding to the 3′ PU.1 binding motif. The average disassociation constant was determined to be 2.609 nM. (D) Average disassociation constants of PU.1 for the three motifs within the EIAV LTR. Values represent means and standard errors of three independent experiments. The inset graphs in panels A to C demonstrate the saturation of the oligonucleotides with PU.1.
FIG. 3.
FIG. 3.
Scatchard analysis of recombinant PU.1 binding to the three PU.1 binding motifs in the EIAV LTR. (A) Representative Scatchard plot of PU.1 binding to the 5′ PU.1 binding motif. The average disassociation constant was determined to be 4.123 nM. (B) Representative Scatchard plot of PU.1 binding to the middle PU.1 binding motif. The average disassociation constant was determined to be 3.269 nM. (C) Representative Scatchard plot of PU.1 binding to the 3′ PU.1 binding motif. The average disassociation constant was determined to be 2.609 nM. (D) Average disassociation constants of PU.1 for the three motifs within the EIAV LTR. Values represent means and standard errors of three independent experiments. The inset graphs in panels A to C demonstrate the saturation of the oligonucleotides with PU.1.
FIG. 4.
FIG. 4.
Binding curves of DH82 NE to an oligonucleotide containing the 5′ and middle PU.1 sites (5′ + mid oligonucleotide; squares) or an oligonucleotide containing the middle and 3′ PU.1 sites (mid + 3′ oligonucleotide; diamonds). All other transcription factor binding motifs that are present in that region of the EIAV LTR enhancer were altered in the oligonucleotides by the introduction of point mutations in the appropriate locations. Lines through the data were simulated by using the association constants resolved from a fit of averaged data.
FIG. 5.
FIG. 5.
Promoter-proximal location of the PU.1 site is critical for optimal Tat-transactivated expression of the LTR. (A) Constructs tested with transient transfections performed in DH82 cells. The 3′ PU.1 binding motif was substituted for both the 5′ and middle PU.1 motifs in 3′ UP. (B) Basal levels of CAT activity in DH82 cells. (C) Tat-transactivated levels of CAT activity.
FIG. 6.
FIG. 6.
HIV enhancer-promoter elements substitute for the EIAV elements in macrophages. (A) Constructs tested in transient transfections performed in DH82 cells. pEIA P4 (30) contains the HIV enhancer-promoter region within the context of the EIAV LTR. (B) Basal levels of expression. (C) EIAV Tat-transactivated levels of expression.
FIG. 7.
FIG. 7.
Three PU.1 sites are not sufficient to support EIAV replication in equine MDMs. (A) Enhancer sequences of the molecular clones tested for infectivity. (B) RT activity of culture supernatants from EIAV-infected MDMs.

Similar articles

Cited by

References

    1. Barboric, M., R. M. Nissen, S. Kanazawa, N. Jabrane-Ferrat, and B. M. Peterlin. 2001. NF-kappaB binds P-TEFb to stimulate transcriptional elongation by RNA polymerase II. Mol. Cell 8:327-337. - PubMed
    1. Berkhout, B., and K. T. Jeang. 1992. Functional roles for the TATA promoter and enhancers in basal and Tat-induced expression of the human immunodeficiency virus type 1 long terminal repeat. J. Virol. 66:139-149. - PMC - PubMed
    1. Carvalho, M., and D. Derse. 1991. Mutational analysis of the equine infectious anemia virus Tat-responsive element. J. Virol. 65:3468-3474. - PMC - PubMed
    1. Carvalho, M., and D. Derse. 1993. The PU.1/Spi-1 proto-oncogene is a transcriptional regulator of a lentivirus promoter. J. Virol. 67:3885-3890. - PMC - PubMed
    1. Carvalho, M., M. Kirkland, and D. Derse. 1993. Protein interactions with DNA elements in variant equine infectious anemia virus enhancers and their impact on transcriptional activity. J. Virol. 67:6586-6595. - PMC - PubMed

Publication types

MeSH terms

LinkOut - more resources