

Purification and crystallization reveal two types of interactions of the fusion protein homotrimer of Semliki Forest virus
- PMID: 15016874
- PMCID: PMC371082
- DOI: 10.1128/jvi.78.7.3514-3523.2004
Purification and crystallization reveal two types of interactions of the fusion protein homotrimer of Semliki Forest virus
Abstract
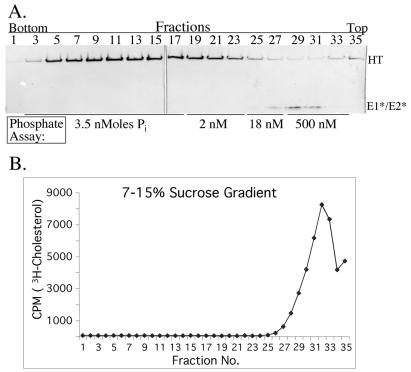
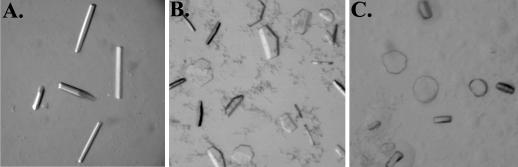
The fusion proteins of the alphaviruses and flaviviruses have a similar native structure and convert to a highly stable homotrimer conformation during the fusion of the viral and target membranes. The properties of the alpha- and flavivirus fusion proteins distinguish them from the class I viral fusion proteins, such as influenza virus hemagglutinin, and establish them as the first members of the class II fusion proteins. Understanding how this new class carries out membrane fusion will require analysis of the structural basis for both the interaction of the protein subunits within the homotrimer and their interaction with the viral and target membranes. To this end we report a purification method for the E1 ectodomain homotrimer from the alphavirus Semliki Forest virus. The purified protein is trimeric, detergent soluble, retains the characteristic stability of the starting homotrimer, and is free of lipid and other contaminants. In contrast to the postfusion structures that have been determined for the class I proteins, the E1 homotrimer contains the fusion peptide region responsible for interaction with target membranes. This E1 trimer preparation is an excellent candidate for structural studies of the class II viral fusion proteins, and we report conditions that generate three-dimensional crystals suitable for analysis by X-ray diffraction. Determination of the structure will provide our first high-resolution views of both the low-pH-induced trimeric conformation and the target membrane-interacting region of the alphavirus fusion protein.
Figures


Similar articles
-
Molecular dissection of the Semliki Forest virus homotrimer reveals two functionally distinct regions of the fusion protein.J Virol. 2002 Feb;76(3):1194-205. doi: 10.1128/jvi.76.3.1194-1205.2002. J Virol. 2002. PMID: 11773395 Free PMC article.
-
Site-directed antibodies against the stem region reveal low pH-induced conformational changes of the Semliki Forest virus fusion protein.J Virol. 2006 Oct;80(19):9599-607. doi: 10.1128/JVI.01054-06. J Virol. 2006. PMID: 16973563 Free PMC article.
-
Multistep regulation of membrane insertion of the fusion peptide of Semliki Forest virus.J Virol. 2004 Apr;78(7):3312-8. doi: 10.1128/jvi.78.7.3312-3318.2004. J Virol. 2004. PMID: 15016852 Free PMC article.
-
Class I and class II viral fusion protein structures reveal similar principles in membrane fusion.Mol Membr Biol. 2004 Nov-Dec;21(6):361-71. doi: 10.1080/09687860400017784. Mol Membr Biol. 2004. PMID: 15764366 Review.
-
[Viral fusion mechanisms].Uirusu. 2005 Dec;55(2):207-19. doi: 10.2222/jsv.55.207. Uirusu. 2005. PMID: 16557006 Review. Japanese.
Cited by
-
Conformational changes in Sindbis virus induced by decreased pH are revealed by small-angle neutron scattering.J Virol. 2012 Feb;86(4):1982-7. doi: 10.1128/JVI.06569-11. Epub 2011 Dec 7. J Virol. 2012. PMID: 22156534 Free PMC article.
-
A structural and functional perspective of alphavirus replication and assembly.Future Microbiol. 2009 Sep;4(7):837-56. doi: 10.2217/fmb.09.59. Future Microbiol. 2009. PMID: 19722838 Free PMC article. Review.
-
A stable prefusion intermediate of the alphavirus fusion protein reveals critical features of class II membrane fusion.Cell Host Microbe. 2008 Dec 11;4(6):600-8. doi: 10.1016/j.chom.2008.10.012. Cell Host Microbe. 2008. PMID: 19064260 Free PMC article.
-
An alternative pathway for alphavirus entry.Virol J. 2011 Jun 15;8:304. doi: 10.1186/1743-422X-8-304. Virol J. 2011. PMID: 21676248 Free PMC article. Review.
-
Small interfering RNA profiling reveals key role of clathrin-mediated endocytosis and early endosome formation for infection by respiratory syncytial virus.J Virol. 2007 Jul;81(14):7786-800. doi: 10.1128/JVI.02780-06. Epub 2007 May 9. J Virol. 2007. PMID: 17494077 Free PMC article.
References
-
- Bligh, E. G., and W. J. Dyer. 1959. A rapid method of total lipid extraction and purification. Can. J. Biochem. Physiol. 37:911-917. - PubMed
-
- Bordier, C. 1981. Phase separation of integral membrane proteins in Triton X-114 solution. J. Biol. Chem. 256:1604-1607. - PubMed
-
- Bullough, P. A., F. M. Hughson, J. J. Skehel, and D. C. Wiley. 1994. Structure of influenza haemagglutinin at the pH of membrane fusion. Nature 371:37-43. - PubMed
Publication types
MeSH terms
Substances
Grants and funding
LinkOut - more resources
Full Text Sources
Other Literature Sources
